

In essence, a root cause analysis involves the identification of problem root causes to devise the most effective solutions. Note that the root cause is an underlying factor that sets the problem in motion or causes a particular situation such as non-conformance.
The Significance of Root Cause Analysis
Root Cause Analysis is a critical tool for organizations and individuals for several key reasons:
1. Problem Prevention
RCA helps prevent the recurrence of problems by addressing their underlying causes. It goes beyond temporary fixes and provides long-term solutions.
2. Continuous Improvement
By identifying root causes, organizations can make targeted improvements to processes, systems, and practices. This fosters a culture of continuous improvement.
3. Risk Reduction
RCA minimizes risks by proactively addressing issues before they escalate. It is particularly valuable in industries where safety and reliability are paramount.
4. Data-Driven Decision-Making
RCA relies on data and evidence to identify root causes. This data-driven approach ensures that decisions are based on facts rather than assumptions.
5. Resource Optimization
Organizations can allocate resources more effectively by focusing on addressing root causes rather than repeatedly dealing with the symptoms of problems.
Understanding a root cause analysis
A root cause analysis (RCA) uncovers the root causes of a problem so that the most effective solutions can be devised.
Root cause analyses can be traced back to the concept of Total Quality Management (TQM), where employees and organizations strive to improve their ability to create valuable products and services for the customer.

TQM follows eight key principles:
- 1. Customer-focused
- 2. Employee engagement
- 3. Process approach
- 4. System integration
- 5. Strategic and systematic approach
- 6. Continual improvement
- 7. Decision-making based on facts
- 8. Communication
And it’s implemented via four phases:
While TQM has since branched off in various directions, the root cause analysis remains a vital component of its continuous improvement philosophy.
Today, root cause analyses have broad applications and are used extensively in manufacturing, telecommunications, industrial process control, and IT.
RCAs are also used in medical diagnoses and in the transportation industry to analyze road, air, and rail accidents.
Root cause analysis methods
There are numerous tools and frameworks that a business can use to conduct a root cause analysis. Some of the most popular are listed here.
Change analysis
This a relatively simple technique based on the notion that change (or difference) can lead to deviations in performance.
The root cause of a problem can be found by comparing the deviated condition with the initial or baseline condition and determining what has changed.
In other words, any change identified becomes the prime candidate for causing the deviation itself.
To ensure the two situations are comparable, practitioners can compare the deviation to a task or operation that has been performed in the past.
They can also use a task or operation similar to the deviated situation or use a detailed task simulation model to reconstruct events if practicable.
Fishbone diagram

The fishbone diagram, also known as the cause-and-effect or Ishikawa diagram, is considered one of the seven basic quality tools for process improvement.
The diagram can be used to structure a brainstorming session and is ideal for teams who have fallen into habitual ways of thinking and operating.
Essentially, the team first agrees on a problem statement and then brainstorms the major categories (causes) of the problem.
Individuals continue to question why a cause may occur as they construct an arrowed diagram similar in appearance to the shape of a fish.
Failure mode and effects analysis (FMEA)

Initially developed by the U.S. military in the 1950s, the FMEA is a step-by-step framework for identifying failures in a design, process, product, or service.
There are two primary components to the failure mode and effects analysis:
- Failure modes – the ways in which something may fail and the errors and defects (whether actual or potential) that may affect the customer, and
- Effects analysis – the study of the consequences of those failures.
Note that failure modes and their associated effects on the system are recorded in a specialized FMEA worksheet.
The subsequent analysis, which may be qualitative or quantitative, was one of the first systematic and structured root cause analysis techniques.
General principles of a root cause analysis
Despite the various approaches to performing a root cause analysis, most are governed by principles such as:
Factor identification
What is the timing, location, nature, and magnitude of the negative outcome some factor is producing?
This will dictate which actions, behaviors, or conditions need to be altered to prevent problem recurrence.
Cost-effectiveness
Root cause analyses strive to prevent problem recurrence in the simplest and most cost-effective means possible.
Performance focus
Removing the root cause of a problem to bolster performance is a more prudent choice than simply removing its symptoms.
Evidence-based
Successful root cause analyses are performed methodically using one of the tools we mentioned earlier.
Conclusions and root cause claims must be supported by verifiable evidence.
Multi-faceted problems
In most cases, there is more than one root cause to every problem.
Treat the symptoms for short-term relief while multiple longer-term solutions are devised.
Root cause analysis and Gap analysis

Where the root cause analysis is very effective in identifying the core issues of an organization.
The gap analysis tries to bring alignment between executing and long-term vision.
In other words, it helps to ask, in the execution process, whether the organization is moving toward its long-term desired goals.
Thus, the root cause analysis combined with the gap analysis can really help align short and long-term.
Root cause analysis vs. 5Whys
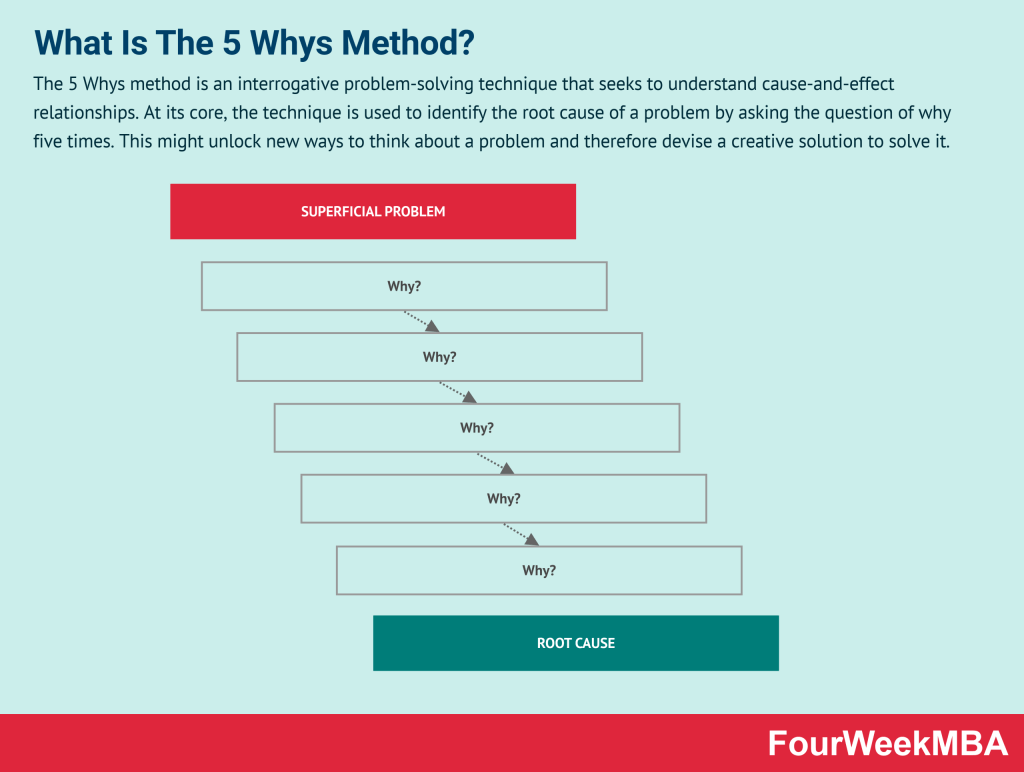
Like the root cause analysis, the 5 whys tries to go to the core of a problem with a simple method of asking five times why to move from the superficial of an issue to the root.
Thus, the 5 whys method can be a great companion to the root cause analysis to uncover fundamental assumptions about the business that can be tested!
Case Studies
- Change Analysis:
- Scenario: A software company notices a decline in user engagement after a recent update.
- RCA Application: By comparing the software before and after the update, they determine that a new feature is causing confusion among users.
- Solution: The company decides to provide clearer onboarding tutorials and roll back certain aspects of the new feature.
- Fishbone Diagram:
- Scenario: A factory is experiencing a high defect rate in one of its products.
- RCA Application: Using a fishbone diagram, they identify potential factors like machinery calibration, raw material quality, operator training, and ambient conditions. They discover that a combination of raw material inconsistencies and machine calibration is to blame.
- Solution: The factory switches to a more reliable material supplier and establishes a stricter machine maintenance schedule.
- Failure Mode and Effects Analysis (FMEA):
- Scenario: An airline company wants to ensure the safety of its new flight procedures.
- RCA Application: FMEA helps them anticipate potential failures. They identify that in rare scenarios, a new landing procedure could be risky.
- Solution: The company modifies the procedure and provides additional training to the pilots.
- 5 Whys:
- Scenario: A restaurant is receiving complaints about delayed service during peak hours.
- RCA Application:
- Why are customers waiting longer? Because orders are backed up.
- Why are orders backed up? Because the kitchen is slow.
- Why is the kitchen slow? Because they are waiting on ingredients.
- Why are they waiting on ingredients? Because the inventory system isn’t effective.
- Why isn’t the system effective? Because it hasn’t been updated to match the new menu.
- Solution: The restaurant updates its inventory system and provides training to the staff on efficient ingredient management.
- Pareto Analysis:
- Scenario: An e-commerce platform wants to reduce customer complaints.
- RCA Application: They list all the complaints and rank them. Using Pareto Analysis, they find that 80% of complaints are about delivery delays.
- Solution: The platform invests in better delivery partners and provides more accurate delivery estimates to customers.
- Fault Tree Analysis:
- Scenario: A power plant experiences frequent blackouts.
- RCA Application: Using a top-down approach, they analyze possible fault points. They determine that a specific transformer is the weak link.
- Solution: The power plant replaces the faulty transformer and establishes a more rigorous inspection schedule.
- Scatter Diagram:
- Scenario: A call center is trying to reduce call duration without sacrificing service quality.
- RCA Application: They plot call durations against different variables like call type, agent, time of day, etc. They notice a pattern where certain agents have longer call durations across all variables.
- Solution: The call center provides additional training and resources to those agents to improve efficiency.
- Check Sheets:
- Scenario: A hotel wants to improve guest satisfaction.
- RCA Application: They create check sheets for housekeeping to record any issues found in rooms. Over time, they notice a pattern of malfunctioning air conditioners.
- Solution: The hotel conducts a comprehensive check of all air conditioners and replaces the faulty ones.
Key takeaways:
- A root cause analysis (RCA) uncovers the root causes of a problem so that the most effective solutions can be devised.
- The origin of root cause analyses can be traced back to Total Quality Management (TQM) where employees and organizations strive to improve their ability to create valuable products and services for the customer.
- Root cause analysis tools include the change analysis, fishbone diagram, and failure mode and effects analysis (FMEA). Despite the various approaches to performing such an analysis, most are governed by common principles.
Key Highlights:
- Root Cause Analysis Definition: Root cause analysis (RCA) is the process of identifying the underlying factors that cause a problem or a particular situation, such as non-conformance, to devise effective solutions.
- Origin of RCA: Root cause analyses can be traced back to the concept of Total Quality Management (TQM) where organizations focus on continuous improvement and providing value to customers.
- TQM Principles: Total Quality Management follows eight key principles, including customer focus, employee engagement, process approach, and continual improvement.
- RCA Methods: Some popular root cause analysis methods are:
- Change analysis: Identifying deviations in performance by comparing current and baseline conditions.
- Fishbone diagram: A diagram-based technique to identify potential causes for a problem through brainstorming.
- Failure mode and effects analysis (FMEA): A structured approach to identifying potential failures during the design stage.
- General Principles of RCA: Common principles governing root cause analysis include factor identification, cost-effectiveness, performance focus, evidence-based analysis, and addressing multi-faceted problems.
- RCA and Gap Analysis: Root cause analysis helps identify core issues, while gap analysis assesses alignment with strategic objectives, ensuring execution is in line with the long-term vision.
- RCA vs. 5 Whys: The 5 Whys method is another problem-solving technique that complements RCA by asking “why” multiple times to uncover underlying assumptions and creative solutions.
| Root Cause Analysis (RCA) | Description | Analysis | Implications | Applications | Examples |
|---|---|---|---|---|---|
| 1. Define the Problem (DP) | RCA begins by clearly defining the problem or issue that needs analysis and resolution. | – Describe the problem’s symptoms and their impact on operations or outcomes. – Gather data and evidence related to the problem. – Establish the scope and boundaries of the analysis. | – Ensures a clear understanding of the problem’s nature and its significance. – Helps in setting the context for the root cause analysis process. | – Investigating equipment failures in a manufacturing facility. – Identifying the reasons for a decline in product quality. | Problem Definition Example: Defining a recurring issue of missed project deadlines. |
| 2. Data Collection (DC) | Collect relevant data and information related to the problem. | – Gather data through various means such as interviews, surveys, observations, or document review. – Identify potential sources of information and evidence. – Ensure data collection is systematic and comprehensive. | – Provides a factual basis for analysis and decision-making. – Ensures that the analysis is based on accurate and relevant information. | – Investigating the causes of a safety incident in a construction project. – Analyzing customer complaints to identify recurring issues. | Data Collection Example: Collecting maintenance records, equipment logs, and incident reports for a machinery breakdown. |
| 3. Cause Identification (CI) | Identify potential causes or factors contributing to the problem. | – Brainstorm and list all possible causes or factors that may be related to the problem. – Categorize causes as immediate (symptoms), contributing, or root causes. – Use tools like the “5 Whys” technique to probe deeper into the causal factors. | – Helps in generating a comprehensive list of potential causes for thorough analysis. – Identifies the distinction between symptoms and underlying causes. | – Determining why a software application frequently crashes. – Investigating the reasons behind a product’s high defect rate. | Cause Identification Example: Identifying possible causes for a sudden drop in website traffic. |
| 4. Data Analysis (DA) | Analyze the collected data to evaluate the potential causes and their relationships. | – Examine the data to identify correlations, patterns, or trends that may point to specific causes. – Use statistical and analytical techniques to test hypotheses and assess causal relationships. – Consider the temporal sequence of events and dependencies. | – Helps in identifying which potential causes are most likely to be root causes. – Provides evidence-based support for causal relationships. | – Analyzing production data to determine why a manufacturing process consistently produces defective products. – Investigating financial data to find the reasons for declining revenue in a retail business. | Data Analysis Example: Analyzing software error logs and user feedback to identify common patterns related to crashes. |
| 5. Root Cause Identification (RCI) | Narrow down the potential causes to identify the true root causes. | – Apply critical thinking and analysis to differentiate between contributing and root causes. – Focus on identifying the causes that, when addressed, will prevent the problem from recurring. – Verify the root causes through additional evidence or testing. | – Enables the precise identification of the underlying issues causing the problem. – Ensures that corrective actions target the true root causes. | – Determining the fundamental reasons behind frequent project delays. – Identifying why a supply chain disruption occurred in a logistics company. | Root Cause Identification Example: Concluding that a software bug in a critical component is the root cause of system crashes. |
| 6. Develop Corrective Actions (CA) | Once root causes are identified, develop specific corrective actions to address them. | – Generate a list of actionable steps and recommendations to eliminate or mitigate the root causes. – Specify responsible individuals or teams for implementing each corrective action. – Set timelines and priorities for corrective actions. | – Ensures that the organization has a clear plan to eliminate the identified root causes. – Facilitates the implementation of preventive measures to avoid recurrence. | – Creating a project plan to address the root causes of product defects. – Developing a strategy to prevent future safety incidents on a construction site. | Corrective Actions Example: Implementing a software patch to fix a critical bug and prevent system crashes. |
| 7. Implement Corrective Actions (ICA) | Execute the corrective actions as planned and monitor their progress. | – Assign responsibilities for each corrective action and ensure accountability. – Track the progress of implementation and ensure that actions are carried out as intended. – Communicate the status of corrective actions to relevant stakeholders. | – Ensures that corrective actions are executed effectively and within specified timelines. – Allows for real-time monitoring and adjustment of actions as needed. | – Carrying out the software patch implementation to fix the root cause of crashes. – Monitoring the construction site to ensure safety measures are in place as per the corrective action plan. | Implementation Example: Rolling out a revised production process to address root causes of product defects. |
| 8. Evaluate Effectiveness (EE) | Assess whether the corrective actions have effectively eliminated the problem. | – Measure and evaluate the impact of corrective actions on the problem. – Use data and performance indicators to assess the effectiveness of actions. – Compare post-implementation results with pre-implementation data to verify improvement. | – Determines whether the root causes have been successfully addressed. – Validates the effectiveness of the corrective actions and their impact on outcomes. | – Assessing whether the new software patch has eliminated system crashes. – Evaluating whether safety incidents have significantly reduced after implementing safety measures on the construction site. | Effectiveness Evaluation Example: Comparing product defect rates before and after process changes to verify improvement. |
Connected Analysis Frameworks
Failure Mode And Effects Analysis


Related Strategy Concepts: Go-To-Market Strategy, Marketing Strategy, Business Models, Tech Business Models, Jobs-To-Be Done, Design Thinking, Lean Startup Canvas, Value Chain — as explored in how AI is restructuring the traditional value chain — , Value Proposition Canvas, Balanced Scorecard, Business Model Canvas, SWOT Analysis, Growth Hacking, Bundling, Unbundling, Bootstrapping, Venture Capital, Porter’s Five Forces, Porter’s Generic Strategies, Porter’s Five Forces, PESTEL Analysis, SWOT, Porter’s Diamond Model, Ansoff, Technology Adoption Curve, TOWS, SOAR, Balanced Scorecard, OKR, Agile Methodology, Value Proposition, VTDF Framework, BCG Matrix, GE McKinsey Matrix, Kotter’s 8-Step Change Model.
Main Guides:
- Business Models
- Business Strategy
- Marketing Strategy
- Business Model Innovation
- Platform Business Models
- Network Effects In A Nutshell
- Digital Business Models


