Comparable Company Analysis: Business And Financial Profile
A comparable company analysis is a process that enables the identification of similar organizations to be used as a comparison to understand the business and financial performance of the target company. In short, we want to select companies, which present the same features as our target firm. The objective, then, is to understand the competitive context of the organization we're analyzing.
Visual Overview
Key Components
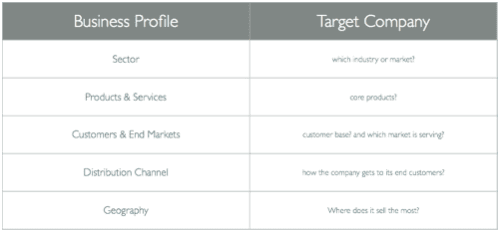
Business Profile
The business profile attains to qualitative aspects of the business, which we can synthesize in five properties:
Financial Profile
The financial profile attains to quantitative aspects of the business. We are going to consider five main elements:
Select Comparable: Apple's case study
It is time to select Apple ’s main comparable.
Real-World Examples
AmazonAppleGoogleMicrosoftSamsungTarget
Quick Answers
What is Business Profile?
The business profile attains to qualitative aspects of the business, which we can synthesize in five properties:
What is Financial Profile?
The financial profile attains to quantitative aspects of the business. We are going to consider five main elements:
What is Select Comparable: Apple's case study?
For simplicity's sake, here I want to highlight the fact that when selected Apple comparable I gave more importance to criteria such as geography, products and services, size, and profitability.
Key Insight
Related Strategy Concepts: Go-To-Market Strategy , Marketing Strategy , Business Models , Tech Business Models , Jobs-To-Be Done , Design Thinking , Lean Startup Canvas , Value Chain , Value Proposition Canvas , Balanced Scorecard , Business Model Canvas , SWOT Analysis , Growth Hacking , Bundling , Unbundling , Bootstrapping , Venture Capital , Porter’s Five Forces , Porter’s Generic Strategies , Porter’s Five Forces , PESTEL Analysis , SWOT ,…
Exec Package + Claude OS Master Skill | Business Engineer Founding Plan
FourWeekMBA x Business Engineer | Updated 2026
Last Updated: April 2026
A comparable company analysis is a process that enables the identification of similar organizations to be used as a comparison to understand the business and financial performance of the target company.
In short, we want to select companies, which present the same features as our target firm.
The objective, then, is to understand the competitive context of the organization we’re analyzing.
Joshua Rosenbaum and Joshua Pearl, authors of “Investment Banking,” offer us two main criteria to select our comparable companies:
The business profile
And the financial profile
These two profiles will help us find those companies that can be used as comparables for our financial analysis.
Comparable Company Analysis (CCA)
Description
Analysis
Implications
Applications
Examples
1. Comparable Company Selection (CCS)
Identify a set of comparable companies in the same industry or sector to serve as benchmarks for analysis.
– Define criteria for selecting comparable companies, such as industry, size, business model, and geography. – Compile a list of potential comparable companies based on the criteria. – Apply screening and filtering to narrow down the list to a final set of peers. – Ensure that the selected peers closely resemble the target company in terms of business and financial characteristics.
– Establishes a peer group that accurately reflects the market and industry dynamics. – Ensures comparability in terms of business operations, industry exposure, and financial performance.
– Valuation of a publicly traded company using market multiples. – Benchmarking a private company’s financial performance against industry peers.
Comparable Company Selection Example: Choosing a group of technology companies with similar revenue size and growth rates as the target tech firm.
2. Business Description and Industry Analysis (BDIA)
Provide an overview of the target company’s business operations, industry position, and competitive landscape.
– Describe the target company’s core products or services, customer segments, and geographical reach. – Conduct an industry analysis, including market trends, growth prospects, and competitive forces. – Identify key competitors and their market shares. – Highlight the target company’s unique value proposition and competitive advantages.
– Offers a comprehensive understanding of the target company’s industry context and competitive position. – Facilitates the assessment of how the company fits within the broader market landscape.
– Evaluating a startup’s market potential and competitive position in a pitch presentation. – Assessing a mature company’s industry positioning for strategic planning.
Business Description and Industry Analysis Example: Providing an overview of a fintech company’s business model and its competitive position in the evolving financial technology sector.
3. Financial Statement Analysis (FSA)
Analyze the historical financial performance and position of both the target company and comparable peers.
– Review financial statements (income statement, balance sheet, cash flow statement) for the target company and comparable peers. – Calculate and compare key financial metrics and ratios, such as revenue, EBITDA, net income, debt levels, and profit margins. – Identify trends and patterns in financial performance over multiple years. – Assess the financial stability and creditworthiness of the target and peers.
– Evaluates the financial health, profitability, and operational efficiency of the target company and peers. – Identifies areas of strength or weakness compared to industry norms and peers.
– Determining a fair market value for an acquisition target using financial statement analysis. – Assessing the creditworthiness of potential lending clients in the banking industry.
Financial Statement Analysis Example: Comparing the revenue growth rates and debt-to-equity ratios of a pharmaceutical company with those of its industry peers.
4. Valuation Multiples Calculation (VMC)
Calculate relevant valuation multiples for both the target company and comparable peers to assess relative value.
– Select appropriate valuation multiples, such as Price-to-Earnings (P/E), Price-to-Sales (P/S), or Enterprise Value-to-EBITDA (EV/EBITDA). – Calculate these multiples for the target company and each comparable peer using historical financial data. – Determine the median or average multiples for the peer group. – Compare the target company’s multiples to those of the peers. – Assess any disparities or deviations in multiples.
– Provides a basis for estimating the target company’s fair market value relative to its peers. – Highlights valuation trends and discrepancies within the industry.
– Determining the fair market value of a startup for investment purposes. – Assessing the relative attractiveness of publicly traded stocks for investment decisions.
Valuation Multiples Calculation Example: Calculating the P/E ratio for a retail company and comparing it to the P/E ratios of other retail peers in the industry.
5. Implications and Decision (ID)
Interpret the results of the CCA and make informed decisions regarding the target company’s valuation and strategic direction.
– Interpret the valuation multiples, financial metrics, and industry positioning derived from the analysis. – Consider the implications of the findings on the target company’s market positioning, competitive strategy, and potential areas for improvement. – Make decisions based on the relative valuation and competitive standing of the target company within the industry.
– Informs stakeholders about the target company’s relative valuation and competitive position. – Guides decisions on pricing, mergers and acquisitions, investment, or strategic planning.
– Making investment decisions by comparing the valuations of multiple potential acquisition targets. – Advising a company on its market positioning strategy based on industry analysis.
Implications and Decision Example: Recommending a higher valuation for a technology startup based on favorable comparisons with industry peers and growth prospects.
Business Profile
The business profile attains to qualitative aspects of the business, which we can synthesize in five properties:
Sector
In what sector does the target company operate?
Product and services
What are the core products and services the target company offers?
Customers and end markets
What’s the customer base? And which market is the company serving?
Distribution channel
How does the target company get to its end customers?
Geography
What is the main market where our target company operates?
For instance, Apple Inc. operates in the consumer goods category and electronic equipment category. Its main products are iPhone, iPod, MAC (which make up most of its revenues).
Apple Inc. distributes its products mainly through its own retails stores and the main market is the U.S. (although the company operates worldwide and currently Greater China also makes up for a good chunk of the company’s sales).
Financial Profile
The financial profile attains to quantitative aspects of the business. We are going to consider five main elements:
Size
Market cap, revenues, net income
Profitability
Average net margin, or gross margin last three or five years
Growth profile
Where does the revenuegrowth come from? Geography and product analysis
Return on investment
Net Income/Total Assets
Credit profile
What rating was the company assigned lately? Or what level of liquidity the company has?
For instance, Apple Inc. 2015 market cap surpassed $500 billion, with over $230 billion in revenues and over $50 billion in net profit.
As for the profitability, the company showed an average net margin (net income/sales) of 23% in the last five years. Its revenuegrowth came mainly from one product, the iPhone and one market, Greater China.
For simplicity’s sake, here I want to highlight the fact that when selected Apple comparable I gave more importance to criteria such as geography, products and services, size, and profitability.
Apple has been able to achieve a dominant position in so many different industries in the tech world, and therefore it has also several direct competitors. For instance, in the smartphone industry, Apple’s direct competitors are Samsung, Sony, Lenovo and so on.
In the personal computer industry, Apple’s main competitors are Microsoft, Dell, HP, and Lenovo. We could go on forever. Although, my assumption here is that de factoApple’s success was mainly due to its ability to integrate several products through a very intuitive interface — as explored in the interface layer wars reshaping consumer tech — that differentiated it from its competitors.
In short, I am assuming that the future battle in the tech industry will be played on the software side, rather than the hardware. Therefore, the two most prominent players, which are competing against Apple in this respect, are Microsoft and Google.
Understand that although the business and financial profiles criteria help use a lot in discerning the competitors of our target company personal judgment is a determinant factor.
For instance, if you believe that the future battle will be played on a different ground you may be tempted to select other comparable for Apple and that is fine. Or you could pick a larger group of comparable than I did. In short, you can personalize the analysis as much as you want if it gives a better picture of Apple’s overall competitive landscape.
CCA Examples In Various Business Verticals
Retail Industry:
A multinational fashion retailer is conducting a CCA to assess its financial performance.
The company selects comparable retailers with similar business profiles (e.g., fashion apparel, multi-brand stores) and financial profiles (e.g., annual revenue, gross margin).
The analysis helps the retailer benchmark its same-store sales growth, inventory turnover, and e-commerce penetration against industry peers.
Key financial metrics include operating margin, inventory turnover, and revenue per square foot.
Business profile aspects include product categories, target demographics, geographic reach, and online vs. brick-and-mortar presence.
Tech Startups:
A tech startup specializing in AI-driven chatbots is seeking venture capital funding.
To justify its valuation, the startup conducts a CCA and identifies similar startups in terms of industry focus (e.g., AI, chatbots), customer base (e.g., B2B, e-commerce), and funding stage.
The analysis showcases the startup’s competitive edge by comparing factors like customer acquisition cost (CAC), monthly recurring revenue (MRR), and churn rate.
Business profile aspects encompass product offerings, target industries, customer segments, and scalability potential.
Financial profile elements include funding rounds, revenue growth, and burn rate.
Banking Sector:
A regional bank is considering merging with a neighboring financial institution.
As part of due diligence, the bank conducts a CCA to assess compatibility.
Comparable companies are selected based on business profiles (e.g., retail banking, asset management) and financial profiles (e.g., total assets, return on equity).
The analysis identifies potential synergies in branch networks, customer base, and operational efficiencies.
Financial metrics of interest include net interest margin (NIM), non-performing loan (NPL) ratios, and Tier 1 capital adequacy.
Business profile aspects include service offerings, geographic footprint, customer demographics, and digital banking capabilities.
Pharmaceutical Companies:
A pharmaceutical company seeks to evaluate its market position in the oncology therapeutic area.
It performs a CCA by identifying comparable companies with a focus on oncology drugs and similar financial characteristics.
The analysis compares research pipelines, drug development timelines, and market share.
Key financial metrics assessed include R&D expenditure as a percentage of revenue, revenue from flagship drugs, and EBITDA margins.
Business profile aspects encompass drug portfolios, clinical trial phases, target patient populations, and global presence.
The analysis helps the company strategize for portfolio expansion and competitive positioning.
Automotive Industry:
An automotive manufacturer is expanding its electric vehicle (EV) offerings.
It conducts a CCA by comparing its EV lineup to established EV manufacturers like Tesla.
Comparable companies are selected based on product range, production capacity, and revenue from EV sales.
The analysis assesses factors such as battery technology, charging infrastructure, and global EV market share.
Financial metrics of interest include revenue from EVs, research and development investments in EV technology, and vehicle delivery volumes.
Business profile aspects include EV models, target customer segments, charging networks, and sustainability initiatives.
Fast Food Chains:
A fast-food chain aims to evaluate its performance relative to peers.
A CCA is conducted by selecting comparable chains in the quick-service restaurant (QSR) segment.
Criteria include product offerings (e.g., burgers, fries), international presence, and revenue per store.
The analysis benchmarks same-store sales growth, franchise expansion strategies, and menu innovation.
Key financial metrics assessed include average transaction value, operating margin, and franchise fee revenue.
Business profile aspects encompass menu diversity, marketing strategies, store formats, and sustainability initiatives.
Energy Sector:
An energy company plans to optimize its renewable energy project investments.
It performs a CCA by comparing itself to renewable energy peers with similar business focuses (e.g., solar, wind).
Financial metrics such as project revenue, EBITDA margins, and project pipeline size are evaluated.
The analysis assesses renewable energy project types, geographic presence, and regulatory environments.
Business profile aspects encompass project development capabilities, renewable energy portfolio diversity, and environmental commitments.
SaaS Companies:
A SaaS company aims to attract investors by justifying its valuation.
It conducts a CCA by selecting peers in the SaaS industry with similar subscription models, customer segments, and recurring revenue growth.
The analysis showcases the company’s scalability, customer acquisition efficiency, and product innovation.
Key financial metrics assessed include annual recurring revenue (ARR), customer churn rate, and customer lifetime value (CLTV).
Business profile aspects encompass software applications, target industries, integration capabilities, and global reach.
Telecommunications:
A telecom operator is evaluating its network infrastructure investments.
A CCA is conducted by comparing the operator to peers with a focus on 5G technology deployment, subscriber growth rates, and capital expenditure efficiency.
The analysis identifies best practices in network rollout and cost optimization.
Financial metrics of interest include capital intensity (capex/revenue), average revenue per user (ARPU), and spectrum holdings.
Business profile aspects encompass network technologies, coverage areas, 5G roadmap, and strategic partnerships.
Hospitality Industry:
A hotel chain assesses its performance in the luxury hospitality segment.
A CCA is performed by selecting comparable luxury hotel brands.
Criteria include average daily rates (ADR), occupancy rates, and guest satisfaction scores.
The analysis benchmarks room revenue, guest loyalty programs, and service offerings.
Key financial metrics assessed include RevPAR (revenue per available room), GOPPAR (gross operating profit per available room), and average length of stay.
Business profile aspects encompass hotel amenities, target clientele, marketing strategies, and sustainability practices.
Agricultural Equipment Manufacturing:
An agricultural equipment manufacturer plans global expansion.
A CCA is conducted by comparing the manufacturer to peers with a similar product portfolio (e.g., tractors, combines).
Financial metrics such as market share, revenue growth, and profitability are assessed.
The analysis identifies market-specific opportunities and competitive advantages.
Business profile aspects encompass product range, distribution channels, customer support, and aftermarket services.
Airlines:
An airline company assesses its competitiveness in the low-cost carrier (LCC) segment.
A CCA is conducted by comparing the airline’s routes, fleet size, load factors, and operating costs to other LCCs.
The analysis identifies potential route expansion opportunities and cost optimization strategies.
Key financial metrics assessed include cost per available seat mile (CASM), revenue per available seat mile (RASM), and load factor.
Business profile aspects encompass route networks, fleet composition, passenger experience, and ancillary revenue sources.
Financial Services Sector:
A fintech startup aims to assess its competitive standing in the digital payments space.
The startup conducts a CCA by selecting peers in the fintech industry with similar payment processing solutions and market positioning.
Criteria include transaction volume, merchant partnerships, and customer acquisition channels.
The analysis benchmarks transaction fees, payment processing speeds, and fraud prevention measures.
Key financial metrics assessed include revenue per transaction, customer retention rates, and regulatory compliance costs.
Business profile aspects encompass payment platforms, integration capabilities, target industries, and geographic expansion plans.
Real Estate Market:
A real estate investment trust (REIT) evaluates its performance in the commercial office space segment.
The REIT conducts a CCA by identifying comparable REITs with a focus on commercial office properties and similar financial structures.
Criteria include property portfolio composition, occupancy rates, and lease renewal trends.
The analysis benchmarks rental income, property maintenance costs, and tenant satisfaction levels.
Key financial metrics assessed include funds from operations (FFO) per share, net operating income (NOI) growth, and capitalization rates.
Business profile aspects encompass property locations, tenant industries, lease terms, and asset management strategies.
E-commerce Industry:
An online marketplace seeks to evaluate its competitive position in the global e-commerce market.
The company performs a CCA by selecting peers with a similar business model (e.g., online retail, third-party sellers) and geographic reach.
Criteria include product categories, customer demographics, and fulfillment capabilities.
The analysis benchmarks gross merchandise volume (GMV), customer acquisition costs, and seller commission rates.
Key financial metrics assessed include revenue growth by region, average order value (AOV), and customer lifetime value (CLTV).
Business profile aspects encompass platform features, seller support services, international expansion strategies, and brand partnerships.
Automotive Manufacturing:
An electric vehicle (EV) startup evaluates its competitive landscape in the electric sedan market.
The startup conducts a CCA by identifying EV manufacturers with similar vehicle offerings and technological capabilities.
Criteria include battery range, charging infrastructure, and autonomous driving features.
The analysis benchmarks vehicle performance metrics, production scalability, and brand reputation.
Key financial metrics assessed include EV sales growth, manufacturing costs per unit, and research investment in battery technology.
Business profile aspects encompass vehicle models, target customer segments, dealership networks, and brand positioning strategies.
Hospitality Sector:
A boutique hotel chain assesses its market positioning in the luxury hospitality segment.
The hotel chain conducts a CCA by selecting comparable luxury hotel brands with a focus on boutique accommodations and personalized service.
Criteria include room rates, occupancy levels, and guest satisfaction ratings.
The analysis benchmarks average daily rates (ADR), revenue per available room (RevPAR), and guest loyalty program benefits.
Key financial metrics assessed include profitability per guest segment, marketing spend effectiveness, and room revenue contribution by season.
Business profile aspects encompass hotel amenities, culinary offerings, concierge services, and experiential packages.
Key Highlights
Purpose and Process: Comparable Company Analysis (CCA) is a method used to understand a target company’s business and financial performance by comparing it to similar companies in the industry. The goal is to identify comparable companies that share similar characteristics for analysis.
Selection Criteria: The selection of comparable companies is based on two main profiles: the business profile and the financial profile. These profiles help ensure a meaningful comparison between companies.
Business Profile: Qualitative aspects of the business are considered, including the sector, core products and services, customer base, distribution channels, and geographical presence.
Financial Profile: Quantitative aspects are analyzed, including size (market cap, revenues, net income), profitability (net margin or gross margin), growth sources (geography, products), return on investment (net income/total assets), and credit profile (rating or liquidity).
Apple Case Study: The example of Apple is used to illustrate the process of selecting comparable companies. When choosing comparable companies for Apple, criteria such as geography, products and services, size, and profitability are given more importance. Apple’s success is attributed to its integration of products through an intuitive interface, differentiating it from competitors.
Comparable Selection Process: The selection of comparables involves personal judgment and considerations about the future competitive landscape. The author suggests that personalization of the analysis is possible to provide a more accurate representation of a target company’s competitive landscape.
Importance of Personal Judgment: While the business and financial profile criteria provide a structured approach, personal judgment plays a significant role in refining the selection of comparable companies. Factors like the future battleground of competition can influence the choice of comparables.
Customization and Analysis: Comparable Company Analysis can be tailored to suit the specific context of the industry, company, and analyst’s insights. This customization allows for a more comprehensive understanding of a target company’s competitive environment.
Related Framework
Description
When to Apply
Industry Classification
– Industry Classification categorizes companies into industry groups based on similarities in products, services, and business models. – Standard industry classification systems such as GICS (Global Industry Classification Standard) or NAICS (North American Industry Classification System) provide a standardized framework for grouping comparable companies.
– Conducting initial screening and selection of comparable companies based on industry peers. – Identifying benchmarking groups or industry cohorts for financial analysis and valuation comparisons.
Financial Ratios Analysis
– Financial Ratios Analysis examines key financial ratios and metrics to assess a company’s financial health, performance, and risk profile. – Common financial ratios include profitability ratios, liquidity ratios, leverage ratios, and efficiency ratios, providing insights into various aspects of a company’s business and financial operations.
– Evaluating and comparing the financial performance and position of comparable companies across different dimensions. – Identifying trends, strengths, weaknesses, and areas for improvement relative to industry peers.
Revenue and Revenue Mix
– Analyzing Revenue and Revenue Mix involves examining a company’s sources of revenue and the composition of its revenue streams across products, services, geographic regions, customer segments, or distribution channels. – Understanding revenue diversification and concentration helps assess a company’s growth prospects, market exposure, and business model resilience.
– Assessing revenue drivers, growth opportunities, and market penetration strategies of comparable companies. – Identifying revenue sources contributing to overall business performance and evaluating revenue sustainability and predictability.
Market Share Analysis
– Market Share Analysis evaluates a company’s market position and competitive standing relative to its peers within the industry. – Market share metrics, such as revenue market share, unit market share, or customer market share, indicate the company’s relative strength or weakness compared to competitors.
– Assessing competitive dynamics and market positioning of comparable companies within the industry landscape. – Understanding market concentration, competitive advantages, and barriers to entry affecting market share dynamics.
Operating Margin and Efficiency
– Analyzing Operating Margin and Efficiency focuses on a company’s profitability and operational efficiency metrics, such as operating margin, gross margin, EBITDA margin, and return on assets (ROA) or return on equity (ROE). – These metrics reflect the company’s ability to generate profits from its core operations and utilize its resources effectively.
– Comparing the operational performance, efficiency, and profitability of comparable companies to assess cost management and operational effectiveness. – Identifying opportunities for margin improvement, cost optimization, or operational streamlining relative to industry peers.
Capital Structure and Debt Levels
– Examining Capital Structure and Debt Levels involves analyzing a company’s capitalization, debt-to-equity ratio, leverage ratios, and debt maturity profile. – Understanding the company’s capital structure and debt levels helps assess its financial risk, solvency, and ability to meet its debt obligations over the long term.
– Evaluating the financial risk, stability, and leverage position of comparable companies within the industry. – Assessing the impact of debt financing on a company’s cost of capital, financial flexibility, and investment opportunities relative to peers.
Cash Flow Generation and Liquidity
– Cash Flow Generation and Liquidity analysis focuses on a company’s ability to generate cash from its operating activities and maintain adequate liquidity to meet short-term obligations. – Key metrics include operating cash flow, free cash flow, cash conversion cycle, and current ratio or quick ratio.
– Assessing the cash flow generation capabilities, liquidity position, and working capital management efficiency of comparable companies. – Identifying liquidity risks, cash flow volatility, or liquidity buffers affecting financial resilience and operational stability.
Growth Prospects and Market Outlook
– Evaluating Growth Prospects and Market Outlook involves assessing a company’s growth trajectory, market opportunities, and industry dynamics. – Factors such as market growth rates, industry trends, competitive positioning, and innovation potential impact a company’s future growth prospects and valuation multiples.
– Analyzing growth drivers, market dynamics, and competitive advantages influencing the growth potential of comparable companies. – Understanding industry disruptions, technological advancements, and regulatory changes shaping market outlook and future growth opportunities.
Valuation Multiples Comparison
– Valuation Multiples Comparison compares a company’s valuation multiples, such as price-to-earnings (P/E) ratio, price-to-sales (P/S) ratio, or enterprise value-to-EBITDA (EV/EBITDA) ratio, to those of its industry peers. – This analysis helps determine whether a company is undervalued, overvalued, or fairly valued relative to its comparable companies.
– Conducting relative valuation analysis to determine a company’s fair value or assess its valuation attractiveness compared to industry peers. – Identifying valuation gaps, mispricings, or market anomalies for potential investment or divestment decisions.
Risk Factors and Contingencies
– Identifying Risk Factors and Contingencies involves assessing a company’s exposure to various internal and external risks that may impact its business operations, financial performance, and valuation. – Common risk factors include market risk, regulatory risk, operational risk, competitive risk, and macroeconomic risk.
– Analyzing risk profiles, risk management strategies, and risk mitigation measures of comparable companies within the industry. – Assessing the impact of risk factors on financial projections, valuation models, and investment decision-making processes.
A failure mode and effects analysis (FMEA) is a structured approach to identifying design failures in a product or process. Developed in the 1950s, the failure mode and effects analysis is one the earliest methodologies of its kind. It enables organizations to anticipate a range of potential failures during the design stage.
Agile Business Analysis (AgileBA) is certification in the form of guidance and training for business analysts seeking to work in agile environments. To support this shift, AgileBA also helps the business analyst relate Agile projects to a wider organizational mission or strategy. To ensure that analysts have the necessary skills and expertise, AgileBA certification was developed.
Business valuations involve a formal analysis of the key operational aspects of a business. A business valuation is an analysis used to determine the economic value of a business or company unit. It’s important to note that valuations are one part science and one part art. Analysts use professional judgment to consider the financial performance of a business with respect to local, national, or global economic conditions. They will also consider the total value of assets and liabilities, in addition to patented or proprietary technology.
A paired comparison analysis is used to rate or rank options where evaluation criteria are subjective by nature. The analysis is particularly useful when there is a lack of clear priorities or objective data to base decisions on. A paired comparison analysis evaluates a range of options by comparing them against each other.
The Monte Carlo analysis is a quantitative risk management technique. The Monte Carlo analysis was developed by nuclear scientist Stanislaw Ulam in 1940 as work progressed on the atom bomb. The analysis first considers the impact of certain risks on project management such as time or budgetary constraints. Then, a computerized mathematical output gives businesses a range of possible outcomes and their probability of occurrence.
A cost-benefit analysis is a process a business can use to analyze decisions according to the costs associated with making that decision. For a cost analysis to be effective it’s important to articulate the project in the simplest terms possible, identify the costs, determine the benefits of project implementation, assess the alternatives.
The CATWOE analysis is a problem-solving strategy that asks businesses to look at an issue from six different perspectives. The CATWOE analysis is an in-depth and holistic approach to problem-solving because it enables businesses to consider all perspectives. This often forces management out of habitual ways of thinking that would otherwise hinder growth and profitability. Most importantly, the CATWOE analysis allows businesses to combine multiple perspectives into a single, unifying solution.
It’s possible to identify the key players that overlap with a company’s business model with a competitor analysis. This overlapping can be analyzed in terms of key customers, technologies, distribution, and financial models. When all those elements are analyzed, it is possible to map all the facets of competition for a tech business model to understand better where a business stands in the marketplace and its possible future developments.
The Pareto Analysis is a statistical analysis used in business decision making that identifies a certain number of input factors that have the greatest impact on income. It is based on the similarly named Pareto Principle, which states that 80% of the effect of something can be attributed to just 20% of the drivers.
A comparable company analysis is a process that enables the identification of similar organizations to be used as a comparison to understand the business and financial performance of the target company. To find comparables you can look at two key profiles: the business and financial profile. From the comparable company analysis it is possible to understand the competitive landscape of the target organization.
A SWOT Analysis is a framework used for evaluating the business’s Strengths, Weaknesses, Opportunities, and Threats. It can aid in identifying the problematic areas of your business so that you can maximize your opportunities. It will also alert you to the challenges your organization might face in the future.
The PESTEL analysis is a framework that can help marketers assess whether macro-economic factors are affecting an organization. This is a critical step that helps organizations identify potential threats and weaknesses that can be used in other frameworks such as SWOT or to gain a broader and better understanding of the overall marketing environment.
Business analysis is a research discipline that helps driving change within an organization by identifying the key elements and processes that drive value. Business analysis can also be used in Identifying new business opportunities or how to take advantage of existing business opportunities to grow your business in the marketplace.
In corporate finance, the financial structure is how corporations finance their assets (usually either through debt or equity). For the sake of reverse engineering businesses, we want to look at three critical elements to determine the model used to sustain its assets: cost structure, profitability, and cash flow generation.
Financial modeling involves the analysis of accounting, finance, and business data to predict future financial performance. Financial modeling is often used in valuation, which consists of estimating the value in dollar terms of a company based on several parameters. Some of the most common financial models comprise discounted cash flows, the M&A model, and the CCA model.
Value investing is an investment philosophy that looks at companies’ fundamentals, to discover those companies whose intrinsic value is higher than what the market is currently pricing, in short value investing tries to evaluate a business by starting by its fundamentals.
The Buffet Indicator is a measure of the total value of all publicly-traded stocks in a country divided by that country’s GDP. It’s a measure and ratio to evaluate whether a market is undervalued or overvalued. It’s one of Warren Buffet’s favorite measures as a warning that financial markets might be overvalued and riskier.
Financial accounting is a subdiscipline within accounting that helps organizations provide reporting related to three critical areas of a business: its assets and liabilities (balance sheet), its revenues and expenses (income statement), and its cash flows (cash flow statement). Together those areas can be used for internal and external purposes.
Post-mortem analyses review projects from start to finish to determine process improvements and ensure that inefficiencies are not repeated in the future. In the Project Management Book of Knowledge (PMBOK), this process is referred to as “lessons learned”.
Retrospective analyses are held after a project to determine what worked well and what did not. They are also conducted at the end of an iteration in Agile project management. Agile practitioners call these meetings retrospectives or retros. They are an effective way to check the pulse of a project team, reflect on the work performed to date, and reach a consensus on how to tackle the next sprint cycle.
In essence, a root cause analysis involves the identification of problem root causes to devise the most effective solutions. Note that the root cause is an underlying factor that sets the problem in motion or causes a particular situation such as non-conformance.
A break-even analysis is commonly used to determine the point at which a new product or service will become profitable. The analysis is a financial calculation that tells the business how many products it must sell to cover its production costs. A break-even analysis is a small business accounting process that tells the business what it needs to do to break even or recoup its initial investment.
Stanford University Professor Ronald A. Howard first defined decision analysis as a profession in 1964. Over the ensuing decades, Howard has supervised many doctoral theses on the subject across topics including nuclear waste disposal, investment planning, hurricane seeding, and research strategy. Decision analysis (DA) is a systematic, visual, and quantitative decision-making approach where all aspects of a decision are evaluated before making an optimal choice.
A DESTEP analysis is a framework used by businesses to understand their external environment and the issues which may impact them. The DESTEP analysis is an extension of the popular PEST analysis created by Harvard Business School professor Francis J. Aguilar. The DESTEP analysis groups external factors into six categories: demographic, economic, socio-cultural, technological, ecological, and political.
The STEEP analysis is a tool used to map the external factors that impact an organization. STEEP stands for the five key areas on which the analysis focuses: socio-cultural, technological, economic, environmental/ecological, and political. Usually, the STEEP analysis is complementary or alternative to other methods such as SWOT or PESTEL analyses.
The STEEPLE analysis is a variation of the STEEP analysis. Where the step analysis comprises socio-cultural, technological, economic, environmental/ecological, and political factors as the base of the analysis. The STEEPLE analysis adds other two factors such as Legal and Ethical.
Activity-based management (ABM) is a framework for determining the profitability of every aspect of a business. The end goal is to maximize organizational strengths while minimizing or eliminating weaknesses. Activity-based management can be described in the following steps: identification and analysis, evaluation and identification of areas of improvement.
PMESII-PT is a tool that helps users organize large amounts of operations information. PMESII-PT is an environmental scanning and monitoring technique, like the SWOT, PESTLE, and QUEST analysis. Developed by the United States Army, used as a way to execute a more complex strategy in foreign countries with a complex and uncertain context to map.
The SPACE (Strategic Position and Action Evaluation) analysis was developed by strategy academics Alan Rowe, Richard Mason, Karl Dickel, Richard Mann, and Robert Mockler. The particular focus of this framework is strategy formation as it relates to the competitive position of an organization. The SPACE analysis is a technique used in strategic management and planning.
A lotus diagram is a creative tool for ideation and brainstorming. The diagram identifies the key concepts from a broad topic for simple analysis or prioritization.
Functional decomposition is an analysis method where complex processes are examined by dividing them into their constituent parts. According to the Business Analysis Body of Knowledge (BABOK), functional decomposition “helps manage complexity and reduce uncertainty by breaking down processes, systems, functional areas, or deliverables into their simpler constituent parts and allowing each part to be analyzed independently.”
The multi-criteria analysis provides a systematic approach for ranking adaptation options against multiple decision criteria. These criteria are weighted to reflect their importance relative to other criteria. A multi-criteria analysis (MCA) is a decision-making framework suited to solving problems with many alternative courses of action.
A stakeholder analysis is a process where the participation, interest, and influence level of key project stakeholders is identified. A stakeholder analysis is used to leverage the support of key personnel and purposefully align project teams with wider organizational goals. The analysis can also be used to resolve potential sources of conflict before project commencement.
Strategic analysis is a process to understand the organization’s environment and competitive landscape to formulate informed business decisions, to plan for the organizational structure and long-term direction. Strategic planning is also useful to experiment with business model design and assess the fit with the long-term vision of the business.
A comparable company analysis is a process that enables the identification of similar organizations to be used as a comparison to understand the…
The business profile attains to qualitative aspects of the business, which we can synthesize in five properties:
The financial profile attains to quantitative aspects of the business.
For simplicity's sake, here I want to highlight the fact that when selected Apple comparable I gave more importance to criteria such as geography,…
Connected Video Lectures
Frequently Asked Questions
What is Comparable Company Analysis: Business And Financial Profile?
A comparable company analysis is a process that enables the identification of similar organizations to be used as a comparison to understand the business and financial performance of the target company. In short, we want to select companies, which present the same features as our target firm. The objective, then, is to understand the competitive context of the organization we're analyzing.
What are the key components of Comparable Company Analysis: Business And Financial Profile?
The key components of Comparable Company Analysis: Business And Financial Profile include Business Profile, Financial Profile, Select Comparable: Apple's case study. Business Profile: The business profile attains to qualitative aspects of the business, which we can synthesize in five properties:
Gennaro is the creator of FourWeekMBA, which reached about four million business people, comprising C-level executives, investors, analysts, product managers, and aspiring digital entrepreneurs in 2022 alone | He is also Director of Sales for a high-tech scaleup in the AI Industry | In 2012, Gennaro earned an International MBA with emphasis on Corporate Finance and Business Strategy.