A financial analysis comprises the set of tools, frameworks, and methodologies to analyze the primary financial statements of companies to make internal (to make managerial decisions) and external (to determine the firm's value or context) assessments. Financial analysis helps determine the state of a company's valuation based on its main financial statements: balance sheet, income statement, and cash flow statement.
Visual Overview
Key Components
Analysis set up
We are going to perform this analysis up by taking three simple steps. But before we do that we have to have all the information needed available. Where do we find this information? Easy, we look at the target company’s website.
Analysis Overview – make a very few assumptions
In many financial analyses (especially those based on forecasts and financial models), the starting point is to make assumptions. In our analysis, instead, we want to make as few assumptions as possible.
In this step, we are going to select a set of ratios that will guide us toward our analysis. Financial ratios are metrics that help us in comprehending the main financial statements.
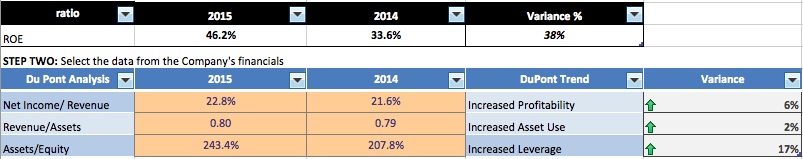
In this phase, we are going to analyze why the profitability increased and what were the factors the influenced it so much. In short, we are going to drill-down into the ROE to see what is going on there.
Step three: select comparable set-up and comparative analysis completion
In this phase here we have to select some comparable. In short, we want to select companies, which present the same features as our target firm. Afterward, we can relate the main financial ratios of our target company against those of the comparable.
Real-World Examples
AmazonAppleGoogleMicrosoftNetflixSamsung
Practical Application
1
You can expand the trend analysis to three or five years if you like. I picked some ratios to analyze Apple Inc. and run them through.
2
This is definitely a good sign. In fact, usually a number, which goes below 60 days, is positive, and in this case below 30 days is an extremely…
3
After completing step one, we can move forward to our second step.
4
In fact, as you can see from the previous table our ROE increased from 33% to 46%.
5
To know more in detail how to perform this analysis check out our previous article on DuPont Analysis here :
Quick Answers
What is Analysis set up?
We are going to perform this analysis up by taking three simple steps. But before we do that we have to have all the information needed available. Where do we find this information? Easy, we look at the target company’s website.
What are the analysis overview – make a very few assumptions?
In many financial analyses (especially those based on forecasts and financial models), the starting point is to make assumptions. In our analysis, instead, we want to make as few assumptions as possible.
What is Step-One: financial ratios set-up & two-year comparison?
In this step, we are going to select a set of ratios that will guide us toward our analysis. Financial ratios are metrics that help us in comprehending the main financial statements. To have a more detailed account of how they work check out our previous article on ratio analysis here .
Key Insight
In this article, we saw how to set up a financial analysis in three steps. In the first step we selected a set of financial data useful to comprehend the performance of our target company.
Exec Package + Claude OS Master Skill | Business Engineer Founding Plan
FourWeekMBA x Business Engineer | Updated 2026
Last Updated: April 2026
A financial analysis comprises the set of tools, frameworks, and methodologies to analyze the primary financial statements of companies to make internal (to make managerial decisions) and external (to determine the firm’s value or context) assessments. Financial analysis helps determine the state of a company’s valuation based on its main financial statements: balance sheet, income statement, and cash flow statement.
Financial Analysis
Description
Analysis
Implications
Applications
Examples
1. Financial Statements (FS)
Review financial statements, including the income statement, balance sheet, and cash flow statement.
– Examine financial statements to assess the company’s financial performance and health. – Analyze income statements for revenue, expenses, and profitability. – Evaluate the balance sheet for assets, liabilities, and equity. – Assess the cash flow statement for cash flows from operations, investments, and financing activities.
– Provides an overview of a company’s financial position, performance, and liquidity. – Highlights trends in revenue, expenses, and profitability. – Indicates the company’s ability to generate cash and manage debts.
– Assessing the financial health of a company before making investment decisions. – Analyzing financial statements for credit risk assessment in lending.
Financial Statements Example: Reviewing a company’s income statement to determine its net profit margin and operating income.
2. Ratio Analysis (RA)
Calculate and interpret financial ratios to assess various aspects of a company’s performance.
– Calculate key financial ratios such as liquidity ratios (e.g., current ratio), profitability ratios (e.g., return on equity), leverage ratios (e.g., debt-to-equity ratio), and efficiency ratios (e.g., inventory turnover). – Interpret the ratios to gain insights into the company’s liquidity, profitability, solvency, and operational efficiency.
– Offers a quantitative assessment of a company’s financial health and performance. – Helps in comparing the company’s performance to industry benchmarks. – Identifies strengths and weaknesses in various financial aspects.
– Evaluating a company’s liquidity using the current ratio. – Assessing profitability through return on assets (ROA) and return on equity (ROE) ratios.
Ratio Analysis Example: Calculating the debt-to-equity ratio to assess a company’s financial leverage and solvency.
3. Trend Analysis (TA)
Analyze financial data over time to identify trends, patterns, and changes in performance.
– Review historical financial data for multiple periods (e.g., years or quarters). – Identify trends in revenue growth, expense management, profitability, and financial stability. – Evaluate the consistency and direction of financial performance indicators.
– Helps in understanding the company’s financial performance dynamics over time. – Aids in forecasting future financial trends and challenges. – Indicates whether the company’s financial health is improving or deteriorating.
– Analyzing annual financial reports to track revenue and profit trends. – Identifying patterns in quarterly cash flow fluctuations.
Trend Analysis Example: Examining a retailer’s revenue trends over the past five years to identify seasonality and growth patterns.
4. Budget Analysis (BA)
Compare actual financial performance to budgeted expectations to assess variance and cost control.
– Analyze the company’s actual financial results in comparison to the budgeted figures. – Identify variances (positive or negative) between actual and budgeted revenue, expenses, and profits. – Evaluate the reasons behind budget variances, such as cost overruns or revenue shortfalls.
– Assesses the effectiveness of budgeting and cost control measures. – Identifies areas where cost management and resource allocation can be improved. – Helps in aligning financial goals with actual outcomes.
– Comparing actual revenue and expense figures to the budget for cost control. – Analyzing budget variances to optimize spending and resource allocation.
Budget Analysis Example: Assessing the variance between the budgeted and actual operating expenses for a fiscal year.
5. Investment Analysis (IA)
Evaluate the financial viability and potential returns of investment opportunities or projects.
– Assess investment opportunities using techniques such as Net Present Value (NPV), Internal Rate of Return (IRR), and Payback Period. – Analyze cash flow projections, investment costs, and expected returns. – Consider risk factors and market conditions when making investment decisions.
– Determines whether an investment is financially sound and generates positive returns. – Helps in selecting projects or assets that align with financial goals and risk tolerance. – Evaluates the impact of investments on cash flow and profitability.
– Evaluating the financial feasibility of a new product launch project. – Assessing the potential return on investment (ROI) for a real estate development.
Investment Analysis Example: Calculating the NPV and IRR of a capital investment project in a manufacturing facility.
We are going to perform this analysis up by taking three simple steps. But before we do that we have to have all the information needed available. Where do we find this information? Easy, we look at the target company’s website.
Analysis Overview – make a very few assumptions
In many financial analyses (especially those based on forecasts and financial models), the starting point is to make assumptions. In our analysis, instead, we want to make as few assumptions as possible.
In fact, we are going to let the financials speak for themselves. How? Through three simple steps: in step number one, we are going to select a set of financial ratios that we will use as analytical tools to understand our target company.
In step number two, we are going to perform a DuPont analysis to understand how the profitabilityevolved over time. Indeed, since we want to make very few assumptions, we are going to drill-down into the ROE and see what influenced it.
And in step number three we are going to compare the financial ratios of our target company against its main comparable. Therefore, before we do that we will have to select a group of comparable companies.
In this step, we are going to select a set of ratios that will guide us toward our analysis. Financial ratios are metrics that help us in comprehending the main financial statements. To have a more detailed account of how they work check out our previous article on ratio analysishere.
In this phase, we have to select some ratios to assess few main aspects of the business model that we will divide into four main categories: profitability, liquidity, leverage and efficiency. In this phase, we are going to leave valuation out, which we are going to include in the third step of our analysis.
Once selected these ratios we have to run them for the current and previous year. This is because we want to understand how the company’s trend evolved over time. In this specific case, I decided to do an analysis for 2014 and 2015 for simplicity sake.
You can expand the trend analysis to three or five years if you like. I picked some ratios to analyze Apple Inc. and run them through. See the results in the following table:
As you can see from the above table I picked ten different ratios and run them to understand how Apple Inc. performance changed from 2014 to 2015. The table shows increased profitability, liquidity, leverage and efficiency.
The only negative number that you see in this table is a good sign. This is because the receivable in days ratio tells us how long it takes for the company to collect the money from the customers that buy on credit.
In short, the shortest the time it takes for a company to collect money from its customers the more it becomes liquid over time. In Apple Inc. specific case, the receivable in days decreased by 12%, from 30.5 days to 26.8 days.
This is definitely a good sign. In fact, usually a number, which goes below 60 days, is positive, and in this case below 30 days is an extremely positive result.
After completing step one, we can move forward to our second step.
In this phase, we are going to analyze why the profitability increased and what were the factors the influenced it so much. In short, we are going to drill-down into the ROE to see what is going on there.
In fact, as you can see from the previous table our ROE increased from 33% to 46%.
As you can see from this table, although the ROE increased substantially it did so due to leverage and profitability. In short, the company was able to improve its revenues but also to contract more debt.
These two factors combined made the company ROE skyrocket. We are ready to move to our third and last step.
Step three: select comparable set-up and comparative analysis completion
In this phase here we have to select some comparable. In short, we want to select companies, which present the same features as our target firm. Afterward, we can relate the main financial ratios of our target company against those of the comparable.
The objective here is to understand the competitive context. In short, although we can make a first assessment of the company’s financials through the first and second step, we are still missing some pieces to complete our puzzle.
Consequently, we are going to use two criteria to select our comparable companies: business model and financial profile. These two profiles will be our guidelines.
Business profile
The business profile attains to qualitative aspects of the business model, which we can synthesize in four properties:
Sector – in what sector does the target company operate?
Product and services – what are the core products and services the target company offers?
Geography – what is the main market where our target company operates?
For instance, Apple Inc. operates in the consumer goods category and electronic equipment category. Its main products are iPhone, iPod, MAC (which make up most of its revenues).
Apple Inc. distributes its products mainly through its own retails stores, and the primary market is the U.S. (although the company operates worldwide and currently Greater China makes up for 25% of the company’s sales).
Financial profile
The financial profile attains to quantitative aspects of the business. We are going to consider five main aspects:
Size – Market cap, revenues, net income
Profitability – Average net margin, or gross margin last three or five years
Growth profile – Where does the revenue growth come from? Geography and product analysis
Return on investment
Credit profile – What rating was the company assigned lately? Or what level of liquidity the company has?
For instance, Apple Inc. 2015 market cap surpassed $500 billion dollars, with over $230 billion dollars in revenues and over $50 billion in net profit.
In addition, as for the profitability, the company showed an average net margin (net income/sales) of 23% in the last 5 years. Its revenue growth came mainly from one product, the iPhone and one market, Greater China.
For simplicity sake, here I want to highlight the fact that when selected Apple comparable I gave more importance to criteria such as geography, products and services, size, and profitability.
In fact, Apple has been able to achieve a powerful position in so many different industries in the tech world and therefore it has also several direct competitors. For instance, in the smartphone industry, Apple’s direct competitors are Samsung, Sony, Lenovo and so on.
Although, my assumption here is that de facto Apple’s success was mainly due to its ability to integrate several products through a very intuitive interface — as explored in the interface layer wars reshaping consumer tech — that differentiated it from its competitors.
In short, I am assuming (sometimes we have to use assumptions) that the future battle in the tech industry will be played on the software side, rather than the hardware. Therefore, the two biggest players, which are competing against Apple in this respect, are Microsoft and Google.
In this table is summarized the financial performance of Apple Inc. in comparison with Microsoft and Google for 2015. As you can see from the date Apple has better profitability and efficiency ratios but also worse liquidity, leverage and market valuation ratios.
Wrap-up and Conclusions
In this article, we saw how to set up a financial analysis in three steps. In the first step we selected a set of financial data useful to comprehend the performance of our target company.
In step-two, we went further and analyzed how the ROE evolved over time.
Eventually in step-three, we sleeted comparable companies, and performed a comparative analysis to determine how our target company performed in comparison to the group of company, which operate in the same context.
From the above analysis, you can already be able to draw some conclusions but also investigate further what is going on with our target company. But I hope this article wasn’t too long. Therefore, we will remand our further investigations to another future occasion.
Key Highlights
Structured Analysis Approach: The article introduces a systematic approach to conducting financial analysis, which can be followed step by step. This structured approach ensures that all relevant aspects of the company’s financial performance are evaluated comprehensively.
Step One – Financial Ratios Set-Up & Comparison:
Relevance of Financial Ratios: Financial ratios are crucial tools that help in assessing a company’s performance from various angles. They provide insights into its profitability, liquidity, operational efficiency, and leverage.
Trend Analysis: By comparing these ratios for the current year and the previous year (or multiple years), analysts can identify trends and changes in the company’s financial health over time.
Interpretation of Ratios: The article highlights the importance of understanding the meaning and implications of each selected financial ratio. For example, a decrease in receivable days could indicate improved liquidity and faster collection of customer payments.
Step Two – DuPont Analysis:
ROE Deconstruction: The DuPont analysis is used to deconstruct the Return on Equity (ROE) metric into its key components, such as net profit margin, asset turnover, and financial leverage. This provides a deeper understanding of the factors driving changes in ROE.
Factors Influencing ROE: By examining each component’s impact on ROE, analysts can identify whether increased profitability is driven by operational efficiency, improved margins, or financial leverage.
Step Three – Comparable Set-Up and Comparative Analysis:
Comparable Selection: The article emphasizes the importance of selecting comparable companies that share similar business models and financial profiles. These comparables should be chosen based on criteria such as sector, products/services, size, profitability, growth, and financial health.
Competitive Context: Comparative analysis enables analysts to evaluate how the target company’s financial performance stacks up against that of its peers. This assessment provides insights into the company’s competitive position within its industry.
Conclusion:
Holistic Insight: By combining financial ratios, DuPont analysis, and comparative analysis, the article’s approach provides a well-rounded view of the company’s financial health, strengths, weaknesses, and competitive landscape.
Data-Driven Decision-Making: This structured approach enables decision-makers to base their strategies on concrete financial data and trends rather than assumptions or limited perspectives.
Investor and Managerial Use: The insights generated from this analysis can be valuable for both external stakeholders (investors, lenders) and internal stakeholders (managers, executives) for making informed decisions.
The circle of competence describes a person’s natural competence in an area that matches their skills and abilities. Beyond this imaginary circle are skills and abilities that a person is naturally less competent at. The concept was popularised by Warren Buffett, who argued that investors should only invest in companies they know and understand. However, the circle of competence applies to any topic and indeed any individual.
Economic or market moats represent the long-term business defensibility. Or how long a business can retain its competitive advantage in the marketplace over the years. Warren Buffet who popularized the term “moat” referred to it as a share of mind, opposite to market share, as such it is the characteristic that all valuable brands have.
The Buffet Indicator is a measure of the total value of all publicly-traded stocks in a country divided by that country’s GDP. It’s a measure and ratio to evaluate whether a market is undervalued or overvalued. It’s one of Warren Buffet’s favorite measures as a warning that financial markets might be overvalued and riskier.
Venture capital is a form of investing skewed toward high-risk bets, that are likely to fail. Therefore venture capitalists look for higher returns. Indeed, venture capital is based on the power law, or the law for which a small number of bets will pay off big time for the larger numbers of low-return or investments that will go to zero. That is the whole premise of venture capital.
Foreign direct investment occurs when an individual or business purchases an interest of 10% or more in a company that operates in a different country. According to the International Monetary Fund (IMF), this percentage implies that the investor can influence or participate in the management of an enterprise. When the interest is less than 10%, on the other hand, the IMF simply defines it as a security that is part of a stock portfolio. Foreign direct investment (FDI), therefore, involves the purchase of an interest in a company by an entity that is located in another country.
Micro-investing is the process of investing small amounts of money regularly. The process of micro-investing involves small and sometimes irregular investments where the individual can set up recurring payments or invest a lump sum as cash becomes available.
Meme stocks are securities that go viral online and attract the attention of the younger generation of retail investors. Meme investing, therefore, is a bottom-up, community-driven approach to investing that positions itself as the antonym to Wall Street investing. Also, meme investing often looks at attractive opportunities with lower liquidity that might be easier to overtake, thus enabling wide speculation, as “meme investors” often look for disproportionate short-term returns.
Retail investing is the act of non-professional investors buying and selling securities for their own purposes. Retail investing has become popular with the rise of zero commissions digital platforms enabling anyone with small portfolio to trade.
Accredited investors are individuals or entities deemed sophisticated enough to purchase securities that are not bound by the laws that protect normal investors. These may encompass venture capital, angel investments, private equity funds, hedge funds, real estate investment funds, and specialty investment funds such as those related to cryptocurrency. Accredited investors, therefore, are individuals or entities permitted to invest in securities that are complex, opaque, loosely regulated, or otherwise unregistered with a financial authority.
Startup valuation describes a suite of methods used to value companies with little or no revenue. Therefore, startup valuation is the process of determining what a startup is worth. This value clarifies the company’s capacity to meet customer and investor expectations, achieve stated milestones, and use the new capital to grow.
Profit is the total income that a company generates from its operations. This includes money from sales, investments, and other income sources. In contrast, cash flow is the money that flows in and out of a company. This distinction is critical to understand as a profitable company might be short of cash and have liquidity crises.
Double-entry accounting is the foundation of modern financial accounting. It’s based on the accounting equation, where assets equal liabilities plus equity. That is the fundamental unit to build financial statements (balance sheet, income statement, and cash flow statement). The basic concept of double-entry is that a single transaction, to be recorded, will hit two accounts.
The purpose of the balance sheet is to report how the resources to run the operations of the business were acquired. The Balance Sheet helps to assess the financial risk of a business and the simplest way to describe it is given by the accounting equation (assets = liability + equity).
The income statement, together with the balance sheet and the cash flow statement is among the key financial statements to understand how companies perform at fundamental level. The income statement shows the revenues and costs for a period and whether the company runs at profit or loss (also called P&L statement).
The cash flow statement is the third main financial statement, together with income statement and the balance sheet. It helps to assess the liquidity of an organization by showing the cash balances coming from operations, investing and financing. The cash flow statement can be prepared with two separate methods: direct or indirect.
The capital structure shows how an organization financed its operations. Following the balance sheet structure, usually, assets of an organization can be built either by using equity or liability. Equity usually comprises endowment from shareholders and profit reserves. Where instead, liabilities can comprise either current (short-term debt) or non-current (long-term obligations).
Capital expenditure or capital expense represents the money spent toward things that can be classified as fixed asset, with a longer term value. As such they will be recorded under non-current assets, on the balance sheet, and they will be amortized over the years. The reduced value on the balance sheet is expensed through the profit and loss.
Financial statements help companies assess several aspects of the business, from profitability (income statement) to how assets are sourced (balance sheet), and cash inflows and outflows (cash flow statement). Financial statements are also mandatory to companies for tax purposes. They are also used by managers to assess the performance of the business.
Financial modeling involves the analysis of accounting, finance, and business data to predict future financial performance. Financial modeling is often used in valuation, which consists of estimating the value in dollar terms of a company based on several parameters. Some of the most common financial models comprise discounted cash flows, the M&A model, and the CCA model.
Business valuations involve a formal analysis of the key operational aspects of a business. A business valuation is an analysis used to determine the economic value of a business or company unit. It’s important to note that valuations are one part science and one part art. Analysts use professional judgment to consider the financial performance of a business with respect to local, national, or global economic conditions. They will also consider the total value of assets and liabilities, in addition to patented or proprietary technology.
The Weighted Average Cost of Capital can also be defined as the cost of capital. That’s a rate – net of the weight of the equity and debt the company holds – that assesses how much it cost to that firm to get capital in the form of equity, debt or both.
A financial option is a contract, defined as a derivative drawing its value on a set of underlying variables (perhaps the volatility of the stock underlying the option). It comprises two parties (option writer and option buyer). This contract offers the right of the option holder to purchase the underlying asset at an agreed price.
A financial analysis comprises the set of tools, frameworks, and methodologies to analyze the primary financial statements of companies to make…
We are going to perform this analysis up by taking three simple steps.
In many financial analyses (especially those based on forecasts and financial models), the starting point is to make assumptions.
In this step, we are going to select a set of ratios that will guide us toward our analysis.
In this phase, we are going to analyze why the profitability increased and what were the factors the influenced it so much.
In this phase here we have to select some comparable.
Connected Video Lectures
Frequently Asked Questions
What is Financial Analysis Example For Complete Beginners?
A financial analysis comprises the set of tools, frameworks, and methodologies to analyze the primary financial statements of companies to make internal (to make managerial decisions) and external (to determine the firm's value or context) assessments. Financial analysis helps determine the state of a company's valuation based on its main financial statements: balance sheet, income statement, and cash flow statement.
What is Analysis set up?
We are going to perform this analysis up by taking three simple steps. But before we do that we have to have all the information needed available. Where do we find this information? Easy, we look at the target company’s website.
What are the analysis overview – make a very few assumptions?
In many financial analyses (especially those based on forecasts and financial models), the starting point is to make assumptions. In our analysis, instead, we want to make as few assumptions as possible.
What is Step-One: financial ratios set-up & two-year comparison?
In this step, we are going to select a set of ratios that will guide us toward our analysis. Financial ratios are metrics that help us in comprehending the main financial statements. To have a more detailed account of how they work check out our previous article on ratio analysis here .
What is Step number two: DuPont analysis?
In this phase, we are going to analyze why the profitability increased and what were the factors the influenced it so much. In short, we are going to drill-down into the ROE to see what is going on there.
What is Step three: select comparable set-up and comparative analysis completion?
In this phase here we have to select some comparable. In short, we want to select companies, which present the same features as our target firm. Afterward, we can relate the main financial ratios of our target company against those of the comparable.
Gennaro is the creator of FourWeekMBA, which reached about four million business people, comprising C-level executives, investors, analysts, product managers, and aspiring digital entrepreneurs in 2022 alone | He is also Director of Sales for a high-tech scaleup in the AI Industry | In 2012, Gennaro earned an International MBA with emphasis on Corporate Finance and Business Strategy.