What Is a DuPont Analysis? How to Perform a DuPont Analysis from Scratch
The DuPont analysis is a financial performance framework which aim is to break down the different financial metrics that affect the return on equity (ROE) to understand what is driving it. Thus, the DuPont Analysis allows having a better understanding of the primary drivers of the return on equity. Financial news is spread anywhere; Gurus at each corner of the road are ready to tell you how to invest your money; Although they trust their advice so much that they don’t even invest in what they say you should invest.
Visual Overview
Key Components
Why is the Dupont Analysis helpful?
The financial world can be pretty confusing at times.
Less is more
The problem of many amateur investors is that they rely too much on external information and overwhelm themselves with useless business knowledge.
One of the most used ratios in finance is the ROE (return on equity).
What data do we need?
To perform the DuPont analysis, we need to perform three ratios:
Extrapolate the data from the financial statements
We will get the sales and net income from the statement of operations. Furthermore, we will get the total assets and equity from the balance sheet . We need the data for 2015 and 2014 to understand the trend.
Exec Package + Claude OS Master Skill | Business Engineer Founding Plan
FourWeekMBA x Business Engineer | Updated 2026
Last Updated: April 2026
The DuPont analysis is a financial performance framework which aim is to break down the different financial metrics that affect the return on equity (ROE) to understand what is driving it. Thus, the DuPont Analysis allows having a better understanding of the primary drivers of the return on equity.
DuPont Analysis
Description
Analysis
Implications
Applications
Examples
1. Key Elements (KE)
DuPont Analysis is a financial performance evaluation method that deconstructs Return on Equity (ROE) into three key components: Profit Margin, Asset Turnover, and Financial Leverage. These elements help assess what drives a company’s ROE.
– Decompose ROE into its three components: Profit Margin, Asset Turnover, and Financial Leverage. – Analyze each component to understand its impact on ROE. – ROE = Profit Margin x Asset Turnover x Financial Leverage.
– Provides a deeper understanding of the sources of ROE. – Helps identify areas for improvement in profitability, asset utilization, or leverage management.
– Evaluating and comparing the financial performance of companies. – Identifying areas for strategic improvement to enhance ROE.
Key Elements Example: ROE = (Net Income / Sales) x (Sales / Total Assets) x (Total Assets / Shareholders’ Equity).
2. Profit Margin (PM)
Profit Margin represents the company’s ability to generate profit from its revenues. It measures the percentage of profit earned for each dollar of sales.
– Calculate Profit Margin as Net Income divided by Revenue. – Analyze Profit Margin to assess how efficiently the company converts sales into profit. – High Profit Margin indicates effective cost control and pricing strategies.
– High Profit Margin suggests strong profitability and cost efficiency. – Low Profit Margin may indicate pricing pressure or cost inefficiencies.
– Evaluating the company’s pricing strategies and cost control measures. – Benchmarking against industry peers.
Profit Margin Example: Profit Margin = (Net Income / Revenue) x 100.
3. Asset Turnover (AT)
Asset Turnover measures the efficiency of the company in utilizing its assets to generate sales. It assesses how many dollars of sales are generated for each dollar of assets.
– Calculate Asset Turnover as Revenue divided by Total Assets. – Analyze Asset Turnover to understand how effectively the company deploys its assets to generate sales. – High Asset Turnover indicates efficient asset utilization.
– High Asset Turnover suggests efficient asset management and sales generation. – Low Asset Turnover may indicate underutilized assets or slow sales turnover.
– Assessing the company’s ability to generate sales from its asset base. – Identifying opportunities to optimize asset utilization.
Asset Turnover Example: Asset Turnover = Revenue / Total Assets.
4. Financial Leverage (FL)
Financial Leverage measures the extent to which the company uses debt financing to magnify returns to shareholders. It evaluates the impact of debt on ROE.
– Calculate Financial Leverage as Total Assets divided by Shareholders’ Equity. – Analyze Financial Leverage to understand the influence of debt on ROE. – High Financial Leverage can amplify ROE but also increases financial risk.
– High Financial Leverage can boost ROE when returns on assets exceed the cost of debt. – It also increases financial risk, as interest expenses can erode profits. – Low Financial Leverage may result in lower ROE but lower financial risk.
– Assessing the trade-off between debt financing benefits and financial risk. – Evaluating the company’s capital structure decisions.
DuPont Analysis combines Profit Margin, Asset Turnover, and Financial Leverage to calculate and understand ROE. It decomposes ROE into its underlying components to provide a comprehensive view of financial performance.
– Calculate ROE using the DuPont formula: ROE = Profit Margin x Asset Turnover x Financial Leverage. – Analyze each component’s contribution to ROE and identify strengths and weaknesses. – Identify areas for improvement in profitability, asset utilization, or leverage management.
– Helps stakeholders understand what drives ROE. – Enables strategic decision-making to enhance ROE by focusing on specific components.
– Evaluating a company’s financial performance and identifying areas for strategic improvement. – Communicating financial performance to stakeholders.
ROE Decomposition Example: ROE = (Net Income / Revenue) x (Revenue / Total Assets) x (Total Assets / Shareholders’ Equity).
Why is the Dupont Analysis helpful?
The financial world can be pretty confusing at times.
Financial news is spread anywhere; Gurus at each corner of the road are ready to tell you how to invest your money;
Although they trust their advice so much that they don’t even invest in what they say you should invest.
Financial magazines offer you subscriptions for a few bucks a year, and you end up buying them all.
The consequence is an excess of information, that although it was supposed to make you feel like an expert actually killed any ability to decide how to invest.
Less is more
The problem of many amateur investors is that they rely too much on external information and overwhelm themselves with useless business knowledge.
They start reading newspapers, watching business channels, and learning the technical jargon that makes them feel part of the game.
This is the “expert fallacy” in action.
Although in some fields knowing more about a subject may make you better at predicting what will happen, this is not the case for the financial world.
In fact, the first principle is “less is more.”
Therefore, rather than concerning yourself with knowing everything is going on in the financial world or wasting your day collecting other people’s opinions, it is time to form your own!
The best analysis is the one you do on your own
Here is the second principle: “the best analysis is the one you do on your own.”
In fact, if it made sense 10-15 years ago to buy financial information, it doesn’t make sense today (save for a few rare exceptions).
You can find reports and useful data anywhere on the web. This allows you to go straight to the source.
Therefore, the objective here is to form your own unbiased opinion.
Simplicity is the maximum sophistication
Third principle: “simplicity is the maximum sophistication.”
Financial charts, formulas, and technical jargon serve to impress people from outside the business world.
Finance is not rocket science, and people from the industry know that.
For such reason, at times these tools are used more as a way to delude rather than for their actual usefulness.
Keep in mind that most of the financial analysis (except very few formulas) is simple arithmetic and common sense, which I am sure everyone possesses.
Having said that, where do we start to perform our analysis?
Zero experience required
The term “financial analysis” may confuse you as well. If you are new to it and if you are not.
You may have approached the discipline in the past and heard many new technical terms, such as LBO, IRR, DCF, CAPM, WACC and you rightly gave all up.
But are those tools necessary to understand the fundamentals of a company?
The answer is a plain “NOT AT ALL!” Although finance professionals use these tools, most of the time they are used more for justifying their pay, rather than for their practicality.
I am not saying those tools are not useful at all, but to the person approaching the financial discipline, it may be too overwhelming.
Therefore, in this article, I want to burst the myth that you have to be a finance professional to perform a practical analysis.
But where do we start?
In this article, I will show you how to analyze a company using the DuPont equation, a straightforward but effective tool.
Keep in mind that the DuPont Analysis doesn’t tell us anything about the future, but a lot about the current state of affairs.
On the other hand, other complex financial tools seem to tell us what will happen in the future, but they are based on assumptions, which, if turned out to be wrong, can be very misleading.
Therefore, we are better off using the DuPont analysis, which is a relatively more straightforward tool, but more useful, rather than a complex tool that gives the impression of understanding, but can lead us to more significant mistakes.
The DuPont analysis uses financial ratios, which are relationships between metrics that we can find on the financial statements.
Let’s start by collecting the financial data we need for the DuPont Analysis.
What to look for?
First, we have to find the financial data for our analysis.
Where do we get it? Bloomberg? Forbes? Financial times? None of them! We just get it from the company’s website.
Before we move forward, what reports do we want to look at?
Assuming our company is listed and located in the U.S., according to the SEC (Security and Exchange Commission), the reports to submit are of three kinds:
• 10K. • 10Q. • 8K.
The 10K and 10Q are very similar forms in which all the financial information (and also the business, strategic and corporate governance information) is reported.
The main difference is that the 10K is an annual report, while the 10Q is a quarterly report. The 8K is a report the company submits each time there are relevant changes to communicate to the investors.
Our purpose here, to analyze the target company is to find the 10K of the firm. Assuming we want to analyze Apple — as explored in the interface layer wars reshaping consumer tech — Inc.’s financials for 2015, where do we get them? Go to www.apple.com, and at the bottom of the page, on the right side, under “About Apple,” click on investors:
Once you do so, it will open up a page where all the financials are shown. Our objective here is to download the 10K for 2015. Therefore click on the “financial information” icon as shown below:
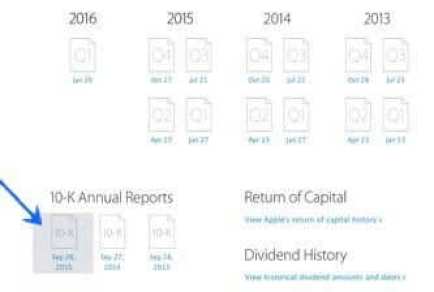
It will open up another screen where all the financial reports are saved. Here we want to download the 10K for 2015.
Follow the instructions below and download your report:
Click on the icon and download the file. It will open up a report. Go to the table of content of the report and look for “financial statements and complementary data:”
Our objective here is to find the consolidated income statement (Apple calls it statements of operations) and balance sheet.
You will find these documents, respectively at pages 39 and 41 of the 10k and they will look like the following:
What is the purpose of the DuPont analysis?
One of the most used ratios in finance is the ROE (return on equity).
This ratio is the relationship between the net income, which is the bottom line of the income statement and the shareholders’ equity (capital endowed by shareholders).
This ratio explains what is the level of return generated for each dollar invested.
For example, a 20% ROE means that for each dollar invested into the business, 20 cents are earnings.
Keep in mind that returns are not dividends.
In other words, the profits generated by the firm will not be automatically distributed to shareholders. Indeed, the part of profits distributed to shareholders is called dividends.
Often a company that produces high returns also distributes higher dividends than non-profitable companies (true in most cases).
In short, a company that can produce a high ROE usually is also well-perceived by investors.
There is a drawback to this ratio tough. The ROE usually increases for three reasons: the net income increases, the shareholders’ equity decreases or both conditions are met.
While the first case is most of the time a good sign, the other condition (the shareholders’ equity decreased) isn’t always a good sign:
An increase in net income is usually due to improved profitability or better efficiency in business operations.
Instead, a decrease in shareholders’ equity is usually associated with higher leverage, which can be bad for the company in the long run.
Therefore the objective here is to see how the ROE evolved over time.
Did it increase from 2014? If so, why?
What data do we need?
To perform the DuPont analysis, we need to perform three ratios:
Net Margin, given by Net Profits over Sales.
The profit margin is a financial profitability ratio given by the net income divided by the net sales and multiplied by a hundred. That is expressed as a percentage. That is a key profitability measure as combined with other financial metrics, it helps assess the overall viability of a business model.
This ratio explains how profitable a company is.
In short, when firms can have excess money left after paying for their expenses, interests, and taxes, this is called net profits.
A high net margin is a good sign, and usually, this happens for two main reasons.
On one hand, when the firm can charge a higher price for its products and services or sell a high quantity of them, the profitability improves.
On the other hand, when a firm can reduce its overall expenses, its profitability improves.
For instance, the company may get a better price for the raw materials due to its good relationship with suppliers.
Therefore, through the net margin, we will check the firm’s profitability level.
Asset Turnover is given by sales over total assets.
The receivable turnover ratio is a financial management metric that measures how efficiently an organization is leveraging its assets. It assesses how many times throughout the year the company is collecting the money from customers.
This ratio explains the ability of the firm to use its assets to generate revenues.
In other words, when a company buys an asset, it does that to improve its revenues in the future.
Therefore, from a firm, which is efficiently managed, we expect that with the increase in the value of its assets, also the revenues will grow.
For instance, Apple opened new retail stores (increased assets) because it wanted to expand its revenue growth.
Furthermore, we can expect that opening new retail stores will positively impact the firm’s revenues. If this condition is met, the company’s assets will be well managed.
This ratio will be expressed as a number and will tell us how much revenue is generated for each dollar invested in assets.
For instance, an asset turnover of 0.50 means that for each dollar invested in assets are produced 50 cents in revenues are.
Financial Leverage is given by total assets over equity.
This ratio will be expressed in percentages and will explain the amount of equity for the assets owned by the organization.
The higher the number, the more debt has been pumped into the company and the riskier the company may become over time.
Usually, leverage itself is not a bad thing. In many circumstances, using debt is way cheaper than using your capital.
For instance, if you try to buy a house, which costs $100K, you can put 100% capital or use 50% capital and borrow 50% from the bank.
Assuming you will sell the house in one year at $120K, your ROI (return on investment) will considerably increase by using leverage.
For instance, if you sell the house for $120K after putting in $100K of capital, your ROI before interest and taxes will be 20%, given by the sale’s profit (120K – 100K) over the initial capital invested (100K).
In the second scenario, you still sell the house for $120K, but in this case, your ROI before interest and taxes will be 40%.
In short, you used leverage (debt) to double your ROI, which didn’t bring any downside.
If financial leverage is not necessarily a bad thing, it starts to be dangerous when interest payments rise steeply and swipe your profits away.
To sum up, given the three ratios above, we need the following data from the financial statements of Apple Inc.: Sales, Net Income, Total Assets, and Equity. We are ready to move forward.
Extrapolate the data from the financial statements
We will get the sales and net income from the statement of operations. Furthermore, we will get the total assets and equity from the balance sheet. We need the data for 2015 and 2014 to understand the trend.
Let’s get sales and net income from the income statement, like in the example below:
Then let’s get total assets and total equity from the balance sheet, like in the example below:
We have the financial data; we can move forward.
Perform the DuPont analysis
We are going to perform this DuPont analysis in three easy steps.
The thing that you notice immediately is that the ROE increased by almost 10% from 2014 to 2015, which means 26% in one year! Pretty astonishing!
We want to know why this happened. We are going to find out in the second step.
Step two: Net Margin, Asset Turnover, and Financial Leverage for 2014 and 2015
We are going to complete this step and divide it into three sub-steps:
Sub-step one: we are going to compute our net margin
Net margin for 2015 = 53,394/233,715 = 22.8% Net margin for 2014 = 39,510/182,795 = 21.6%
The net margin for 2015 is 22.8%, which means that Apple Inc. still has 22.8% of the money left after paying all its suppliers, business expenses, interests (although Apple didn’t pay any in 2015), and taxes.
In addition, the profitability slightly improved from 2014 to 2015 (5.7% increase).
Sub-step two: also, in this case, it is common to use the average total assets, but for simplicity, we are going to take the total assets for the current year. We are going to compute the asset turnover
Asset turnover for 2015 = 233,715/290,479 = $0.80 Asset turnover for 2014 = 182,795/231839 = $0.79
Remember that this ratio is expressed as a number, which we will interpret as a $ amount.
In this case, Apple Inc. in 2015 produced 80 cents of revenues for each dollar of asset invested. The asset turnover grew by 2% in 2015 compared to 2014.
Sub-step three: we are going to compute the financial leverage:
Financial leverage for 2015 = 290,479/119,355 = 243.4% Financial leverage for 2014 = 231,839/111,547 = 207.8%
The financial leverage in 2015 was 243.4%, which means that most of the company’s assets have been financed through debt.
Indeed, total liabilities (all the debt outstanding of the firm) represent 59% of the total assets. The financial leverage of the company increased by 17% in 2015.
We are ready to move forward and draw some conclusions here.
Step three: conclusions from DuPont analysis
By performing the DuPont Analysis, it came out that although the ROE increased by 26% in 2015, this happened mainly due to financial leverage.
In short, Apple Inc. increased its level of debt considerably in the last year while its shareholders’ equity didn’t keep pace.
In fact, profitability and asset efficiency, respectively increased by 6% and 2% in 2015. Instead, financial leverage increased by 17%!
This is not necessarily a bad thing.
In fact, it seems that Apple will be able to manage its interest payments in the future, given its high profitability.
On the other hand, due to this increased debt burden, we may expect to see fewer profits in the future. We may go even further and check in the 10K why Apple Inc. is using debt to increase its ROE, but we will stop here for simplicity’s sake.
Drawbacks of DuPont Analysis
Oversimplification of Financial Health
While providing valuable insights, DuPont Analysis can sometimes oversimplify the assessment of a company’s financial health. It focuses primarily on ROE and does not encompass all aspects of financial performance.
Potential Misinterpretation
The decomposition of ROE into different components can lead to misinterpretation. A high ROE derived primarily from high financial leverage, for example, might mask underlying operational weaknesses.
Ignoring Market and Industry Factors
DuPont Analysis mainly focuses on internal company metrics and may not adequately account for external market and industry factors that can significantly impact financial performance.
Short-term Focus
There is a risk of focusing too much on short-term improvements in ROE, potentially at the expense of long-term sustainability and growth.
Not Accounting for Non-Financial Factors
The analysis does not consider non-financial factors such as customer satisfaction, employee engagement, or environmental impact, which can be crucial for the overall health and sustainability of a business.
When to Use DuPont Analysis
In Financial Performance Analysis
DuPont Analysis is particularly useful for a detailed analysis of a company’s financial performance, especially when trying to understand the drivers behind ROE.
For Comparing Companies within the Same Industry
It is beneficial for comparing the financial performance of different companies within the same industry, as it helps to identify which companies are more efficient in generating earnings.
In Investment Decision-Making
Investors can use DuPont Analysis to assess the attractiveness of potential investment opportunities by understanding the source of a company’s ROE.
During Strategic Planning
Business leaders can employ DuPont Analysis during strategic planning to identify areas for operational improvement and better financial management.
How to Implement DuPont Analysis
Calculate ROE
Begin by calculating the Return on Equity, which is Net Income divided by Shareholder’s Equity.
Break Down ROE
Decompose ROE into three components: Profit Margin (Net Income/Revenue), Asset Turnover (Revenue/Assets), and Financial Leverage (Assets/Equity).
Analyze Each Component
Analyze each component to understand how they contribute to the overall ROE. Assess areas where performance can be improved.
Compare with Industry Benchmarks
Compare the findings with industry benchmarks to understand the company’s performance relative to its peers.
Formulate Strategies
Based on the analysis, formulate strategies to improve weak areas, whether they are in profitability, asset utilization, or financial leverage.
What to Expect from Implementing DuPont Analysis
Enhanced Understanding of Financial Performance
DuPont Analysis provides a more detailed understanding of the factors driving a company’s financial performance.
Identification of Strengths and Weaknesses
The method helps in pinpointing specific operational, profitability, or financial areas that are strengths or weaknesses.
Informed Decision Making
The insights gained from DuPont Analysis can lead to more informed business and investment decisions.
Better Strategic Focus
Companies can use the analysis to focus their strategic efforts on areas that will most effectively improve ROE.
Comprehensive Financial Assessment
While not exhaustive, DuPont Analysis adds depth to the financial assessment of a company, going beyond the surface-level evaluation of ROE.
Conclusions
In this article, I wanted to show you that it is possible also for the non-finance professional to make his analyses by using tools that are simple and effective.
So far, we took some metrics from the primary financial statements to understand what was going on with Apple Inc. ROE, and we ended up analyzing the profitability, asset use, and financial leverage of the company. This is, of course, part of the picture, but it is a good starting point.
If so far you thought that learning financial analysis was impossible for you, you may want to reconsider that.
The circle of competence describes a person’s natural competence in an area that matches their skills and abilities. Beyond this imaginary circle are skills and abilities that a person is naturally less competent at. The concept was popularised by Warren Buffett, who argued that investors should only invest in companies they know and understand. However, the circle of competence applies to any topic and indeed any individual.
Economic or market moats represent the long-term business defensibility. Or how long a business can retain its competitive advantage in the marketplace over the years. Warren Buffet who popularized the term “moat” referred to it as a share of mind, opposite to market share, as such it is the characteristic that all valuable brands have.
The Buffet Indicator is a measure of the total value of all publicly-traded stocks in a country divided by that country’s GDP. It’s a measure and ratio to evaluate whether a market is undervalued or overvalued. It’s one of Warren Buffet’s favorite measures as a warning that financial markets might be overvalued and riskier.
Venture capital is a form of investing skewed toward high-risk bets, that are likely to fail. Therefore venture capitalists look for higher returns. Indeed, venture capital is based on the power law, or the law for which a small number of bets will pay off big time for the larger numbers of low-return or investments that will go to zero. That is the whole premise of venture capital.
Foreign direct investment occurs when an individual or business purchases an interest of 10% or more in a company that operates in a different country. According to the International Monetary Fund (IMF), this percentage implies that the investor can influence or participate in the management of an enterprise. When the interest is less than 10%, on the other hand, the IMF simply defines it as a security that is part of a stock portfolio. Foreign direct investment (FDI), therefore, involves the purchase of an interest in a company by an entity that is located in another country.
Micro-investing is the process of investing small amounts of money regularly. The process of micro-investing involves small and sometimes irregular investments where the individual can set up recurring payments or invest a lump sum as cash becomes available.
Meme stocks are securities that go viral online and attract the attention of the younger generation of retail investors. Meme investing, therefore, is a bottom-up, community-driven approach to investing that positions itself as the antonym to Wall Street investing. Also, meme investing often looks at attractive opportunities with lower liquidity that might be easier to overtake, thus enabling wide speculation, as “meme investors” often look for disproportionate short-term returns.
Retail investing is the act of non-professional investors buying and selling securities for their own purposes. Retail investing has become popular with the rise of zero commissions digital platforms enabling anyone with small portfolio to trade.
Accredited investors are individuals or entities deemed sophisticated enough to purchase securities that are not bound by the laws that protect normal investors. These may encompass venture capital, angel investments, private equity funds, hedge funds, real estate investment funds, and specialty investment funds such as those related to cryptocurrency. Accredited investors, therefore, are individuals or entities permitted to invest in securities that are complex, opaque, loosely regulated, or otherwise unregistered with a financial authority.
Startup valuation describes a suite of methods used to value companies with little or no revenue. Therefore, startup valuation is the process of determining what a startup is worth. This value clarifies the company’s capacity to meet customer and investor expectations, achieve stated milestones, and use the new capital to grow.
Profit is the total income that a company generates from its operations. This includes money from sales, investments, and other income sources. In contrast, cash flow is the money that flows in and out of a company. This distinction is critical to understand as a profitable company might be short of cash and have liquidity crises.
Double-entry accounting is the foundation of modern financial accounting. It’s based on the accounting equation, where assets equal liabilities plus equity. That is the fundamental unit to build financial statements (balance sheet, income statement, and cash flow statement). The basic concept of double-entry is that a single transaction, to be recorded, will hit two accounts.
The purpose of the balance sheet is to report how the resources to run the operations of the business were acquired. The Balance Sheet helps to assess the financial risk of a business and the simplest way to describe it is given by the accounting equation (assets = liability + equity).
The income statement, together with the balance sheet and the cash flow statement is among the key financial statements to understand how companies perform at fundamental level. The income statement shows the revenues and costs for a period and whether the company runs at profit or loss (also called P&L statement).
The cash flow statement is the third main financial statement, together with income statement and the balance sheet. It helps to assess the liquidity of an organization by showing the cash balances coming from operations, investing and financing. The cash flow statement can be prepared with two separate methods: direct or indirect.
The capital structure shows how an organization financed its operations. Following the balance sheet structure, usually, assets of an organization can be built either by using equity or liability. Equity usually comprises endowment from shareholders and profit reserves. Where instead, liabilities can comprise either current (short-term debt) or non-current (long-term obligations).
Capital expenditure or capital expense represents the money spent toward things that can be classified as fixed asset, with a longer term value. As such they will be recorded under non-current assets, on the balance sheet, and they will be amortized over the years. The reduced value on the balance sheet is expensed through the profit and loss.
Financial statements help companies assess several aspects of the business, from profitability (income statement) to how assets are sourced (balance sheet), and cash inflows and outflows (cash flow statement). Financial statements are also mandatory to companies for tax purposes. They are also used by managers to assess the performance of the business.
Financial modeling involves the analysis of accounting, finance, and business data to predict future financial performance. Financial modeling is often used in valuation, which consists of estimating the value in dollar terms of a company based on several parameters. Some of the most common financial models comprise discounted cash flows, the M&A model, and the CCA model.
Business valuations involve a formal analysis of the key operational aspects of a business. A business valuation is an analysis used to determine the economic value of a business or company unit. It’s important to note that valuations are one part science and one part art. Analysts use professional judgment to consider the financial performance of a business with respect to local, national, or global economic conditions. They will also consider the total value of assets and liabilities, in addition to patented or proprietary technology.
The Weighted Average Cost of Capital can also be defined as the cost of capital. That’s a rate – net of the weight of the equity and debt the company holds – that assesses how much it cost to that firm to get capital in the form of equity, debt or both.
A financial option is a contract, defined as a derivative drawing its value on a set of underlying variables (perhaps the volatility of the stock underlying the option). It comprises two parties (option writer and option buyer). This contract offers the right of the option holder to purchase the underlying asset at an agreed price.
What Is a DuPont Analysis? How to Perform a DuPont Analysis from Scratch?
The DuPont analysis is a financial performance framework which aim is to break down the different financial metrics that affect the return on equity (ROE) to understand what is driving it. Thus, the DuPont Analysis allows having a better understanding of the primary drivers of the return on equity.
What is Less is more?
The problem of many amateur investors is that they rely too much on external information and overwhelm themselves with useless business knowledge.
What is the best analysis is the one you do on your own?
Here is the second principle: “ the best analysis is the one you do on your own. ”
What is Simplicity is the maximum sophistication?
Third principle: “ simplicity is the maximum sophistication. ”
What is Zero experience required?
The term “ financial analysis ” may confuse you as well. If you are new to it and if you are not.
Gennaro is the creator of FourWeekMBA, which reached about four million business people, comprising C-level executives, investors, analysts, product managers, and aspiring digital entrepreneurs in 2022 alone | He is also Director of Sales for a high-tech scaleup in the AI Industry | In 2012, Gennaro earned an International MBA with emphasis on Corporate Finance and Business Strategy.