While Google and Facebook rely on advertising as the primary source of revenue, they are two completely different business models.
Both are attention-based or attention merchants, yet there are many key differences.
In an asymmetric businessmodel, the organization doesn’t monetize the user directly, but it leverages the data users provide coupled with technology, thus having a key customer pay to sustain the core asset. For example, Google makes money by leveraging users’ data, combined with its algorithms sold to advertisers for visibility. This is how attention merchants make monetize their business models.
Advertising: Google is search-based, whereas Facebook is feed-based
In short, on Google, you get advertising based on searches that users input into it.
Compared to the feed, search is a pull mechanism, where Google needs to interpret the intent behind the users’ search to serve ads properly.
On the other hand, for Facebook, the ad machine works by pushing relevant ads to users in their feeds.
It’s important to highlight that also Google has changed a lot in the last few years. And today, in many cases (like Google Discover, and YouTube), also Google’s advertising is more similar to that of Facebook.
Vertical Integration: whereas Google is vertically integrated, owning the whole data supply chain, Facebook is not
In fact, Google has successfully built over the years its supply chain, starting from the operating system (Android), browser (Chrome), and tools (Google search and others) to power up the whole ecosystem.
In addition to that, Google now has also a successful line of hardware products, its Pixel phones, which represent a further step in controlling the supply chain of data.
In fact, by having its smartphones in the hands of millions of people, Google can enhance the distribution of its products and speed up the testing of new products.
On the contrary, Facebook has never built a successful smartphone or hardware for consumers.
This is quite limiting and the reason why Facebook has been pushing toward the Metaverse, with the hope of building a valuable device for VR.
That only happened in part with the acquisition of Oculus, which as of now, though, is more of a gaming console than else.
Cost Structure: Google shares revenues, Facebook does not
In fact, even though most of Google’s revenues come from its properties, Google also has a network for publishers (AdSense) that shares revenues with them.
In addition, YouTube, part of Google’s family of products, also has a mechanism of revenue sharing with creators, which enabled a whole ecosystem to thrive and become stronger and stronger over the years.
This wasn’t true for Facebook, which enjoyed wider margins than Google over the years, as it didn’t share revenues with its creators; over time, this went against the company.
In the current scenario, where a competitor offers more opportunities to creators to monetize their content, many might flock to an alternative platform.
Mark Zuckerberg is the largest shareholder in the company. Zuckerberg retains ownership and control of the company. Like Google, Facebook has issued two common stocks, Class A and Class B. The holders of Class B common stocks are entitled to ten votes per share, and holders of our Class A common stocks are entitled to one vote per share. Mark Zuckerberg has a voting power of 61.1%; he’s the primary decision-maker. Other individual investors comprise Sheryl Sandberg, Christopher Cox, Marc Andreessen, Peter Thiel, Dustin Moskovitz, and Eduardo Saverin.
Facebook, the main product of Meta is an attention merchant. As such, its algorithms condense the attention of over 2.91 billion monthly active users as of June 2021. Meta generated $117.9 billion in revenues, in 2021, of which $114.9 billion from advertising (97.4% of the total revenues) and over $2.2 billion from Reality Labs (the augmented and virtual reality products arm).
Facebook generated most of its revenue from advertising in 2023. Indeed, the company generated $131.95B from advertising, $1.89B billion from its reality labs segment, and over a billion in other revenue.
By September 2022, Facebook’s (Meta) employee count had peaked at 87,314. Yet, as revenue slew down for the first time in years, the company announced a layoff of 13% of its workforce, bringing the headcount to 75,964. By March 2023, Meta announced another round of layoffs, dubbed “The Year of Efficiency,” which brought the headcount down to less than 66 thousand employees. By the end of 2023, Facebook reported 67,317 employees.
In 2022, post layoffs, Facebook generated $1,535,056 per employee, compared to $1,638,586 in 2021. In 2023, as Facebook (now Meta) completed its mass layoffs, the company reported nearly $135 billion in revenue and 67,317 employees, with a $2,003,981 revenue per employee.
Facebook (Meta) gained users in 2023. In fact, in 2023, Facebook had over three billion users worldwide, of which 272 million were in Canada, 408 million were in Europe, over 1.3 billion were in Asia, and over a billion were in the rest of the world.
ARPU, or average revenue per user, is a crucial metric for attention merchants like Facebook. It assesses the ability of the platform to monetize its users. For instance, by the end of 2023, Meta’s ARPU worldwide was $13.12. In the US & Canada, it was $68.44; in Europe, it was $23.14; in Asia-Pacific, $5.52; and in the rest of the world, it was $4.50.
ARPU, or average revenue per user, is a crucial metric for attention merchants like Facebook. It assesses the ability of the platform to monetize its users. For instance, by the end of 2023, Meta’s ARPU worldwide was $13.12. In the US & Canada, it was $68.44; in Europe, it was $23.14; in Asia-Pacific, $5.52; and in the rest of the world, it was $4.50.
Facebook (Meta) revenue in 2023 increased to $134.9B, compared to $116.6B in 2022. Its profitability increased to $39.1B in 2023, compared to $23.2B in 2022 and $39.37B in 2021.
Facebook is characterized by a multi-faceted matrix organizational structure. The company utilizes a flat organizational structure in combination with corporate function-based teams and product-based or geographic divisions. The flat organization structure is organized around the leadership of Mark Zuckerberg, and the key executives around him. On the other hand, the function-based teams based on the main corporate functions (like HR, productmanagement, investor relations, and so on).
Instagram makes money via visual advertising. Acquired by Facebook for a billion-dollar in 2012, today, Instagram is integrated into the overall Facebook (now rebranded as Meta) business strategy. In 2018, Instagram founders Kevin Systrom and Mike Krieger left the company as Facebook pushed toward tighter integration of the two platforms. In 2022, Instagram is the most successful product still, in Meta’s portfolio.
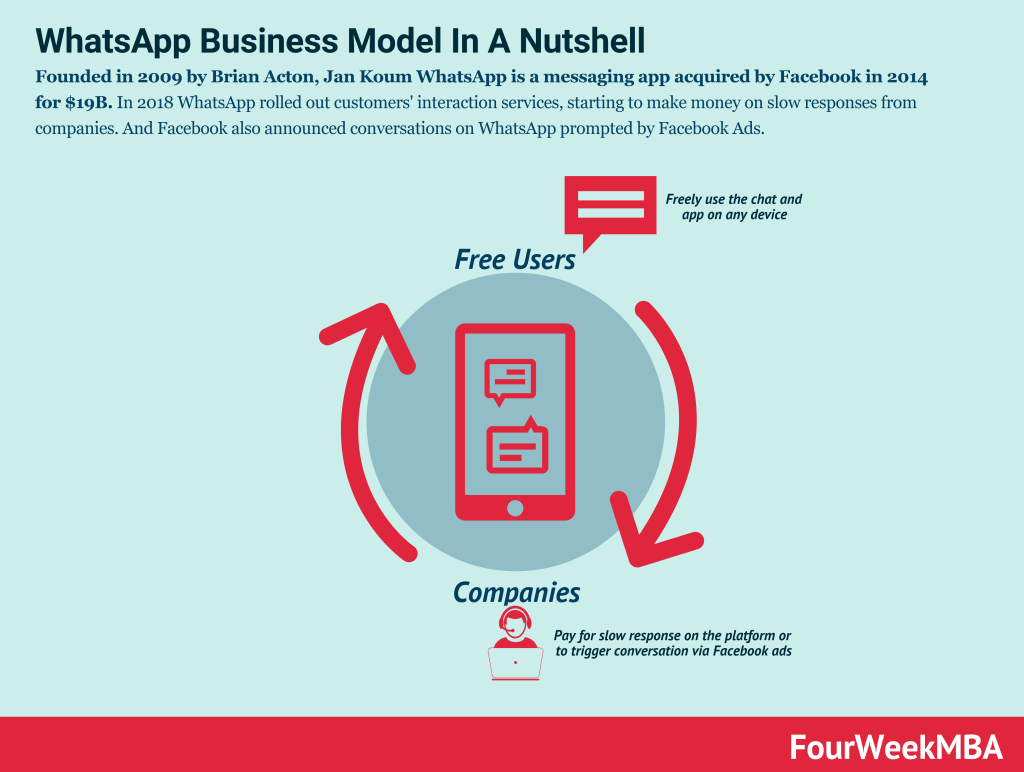
Founded in 2009 by Brian Acton, Jan Koum WhatsApp is a messaging app acquired by Facebook in 2014 for $19B. In 2018 WhatsApp rolled out customers’ interaction services, starting to make money on slow responses from companies. And Facebook also announced conversations on WhatsApp prompted by Facebook Ads.
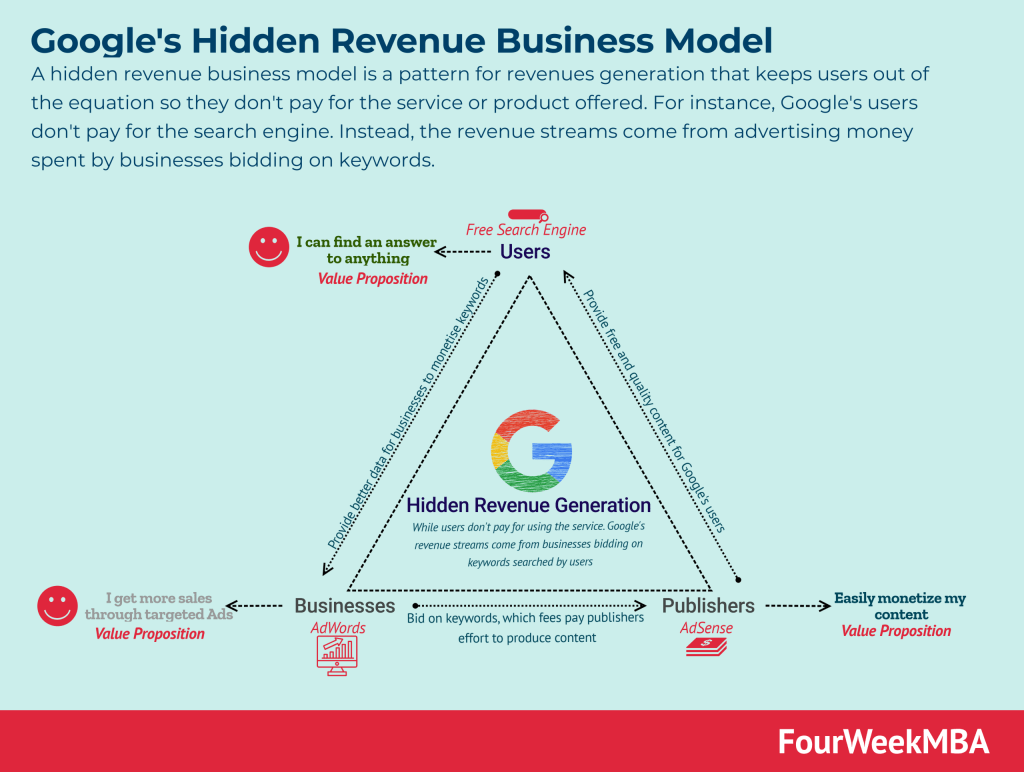
A hidden revenuebusiness model is a pattern for revenue generation that keeps users out of the equation, so they don’t pay for the service or product offered. For instance, Google’s users don’t pay for the search engine. Instead, the revenue streams come from advertising money spent by businesses bidding on keywords.
TikTok is a Chinese creative social media platform driven by short-form video content enabling users to interact and generate content at scale. TikTok primarily makes money through advertising, and it generated $4.6 billion in advertising revenues in 2021, thus making it among the most popular attention-based business models or attention merchants.
Instagram makes money via visual advertising. As part of Facebook products, the company generates revenues for Facebook Inc.’s overall businessmodel. Acquired by Facebook for a billion dollars in 2012, today Instagram is integrated into the overall Facebook business strategy. In 2018, Instagram founders, Kevin Systrom and Mike Krieger left the company, as Facebook pushed toward tighter integration of the two platforms.
YouTube was acquired for almost $1.7 billion in 2006 by Google. It makes money through advertising and subscription revenues. YouTube advertising network is part of Google Ads, and it generated more than $28B in revenue by 2021. YouTube also makes money with its paid memberships and premium content.
Twitter makes money in two ways: advertising and data licensing. In 2021, Twitter generated $4.5 billion from advertising and $570 million from data licensing. While Twitter generated $5 billion in total revenues, it lost 221 million.
Google is primarily owned by its founders, Larry Page and Sergey Brin, who have more than 51% voting power. Other individual shareholders comprise John Doerr (1.5%), a venture capitalist and early investor in Google, and CEO, Sundar Pichai. Former Google CEO Eric Schmidt has 4.2% voting power. The most prominent institutional shareholders are mutual funds BlackRock and The Vanguard Group, with 2.7% and 3.1%, respectively.
Google (now Alphabet) primarily makes money through advertising. The Google search engine, while free, is monetized with paid advertising. In 2023, Alphabet generated over $175B from Google search, $31.51B billion from the Network members (Adsense and AdMob), $31.31B billion from YouTube Ads, $33B from Google Cloud, and $34.69B billion from other sources (Google Play, Hardware devices, and other services). And $1.53B from its other bets.
Google is an attention merchant that – in 2022 – generated over $224 billion (almost 80% of revenues) from ads (Google Search, YouTube Ads, and Network sites), followed by Google Play, Pixel phones, YouTube Premium (a $29 billion segment), and Google Cloud ($26.2 billion).
Of Google’s (Alphabet) over $307.39 billion in revenue for 2023, Google also generated for the first time, well over 1.5 billion dollars in revenue from its bets, which Google considers potential moonshots (companies that might open up new industries). Google’s bets also generated a loss for the company of over $4 billion in the same year. In short, Google is using the money generated by search and betting it on other innovative industries, which are ramping up in 2023.
In 2023, Alphabet’s (Google) Cloud Business generated over $33 billion within Alphabet’s Google overall businessmodel, and it was also profitable, with over $1.7 billion in profits. Google Cloud is instrumental to Google’s AI strategy.
Google is an attention merchant that – in 2023 – generated $237.85 billion (over 77% of its total revenues) from ads (Google Search, YouTube Ads, and Network sites), followed by Google Play, Pixel phones, YouTube Premium (a $31.5 billion segment), and Google Cloud (over $33 billion).
The traffic acquisition cost represents the expenses incurred by an internet company, like Google, to gain qualified traffic – on its pages – for monetization. Over the years, Google has been able to reduce its traffic acquisition costs and, in any case, to keep it stable. In 2023 Google spent 21.39% ($50.9 billion) of its total advertising revenues ($237.8 billion) to guarantee its traffic on several desktop and mobile devices across the web.
YouTube was acquired for almost $1.7 billion in 2006 by Google. It makes money through advertising and subscription revenues. YouTube advertising network is part of Google Ads, and it reported more than $31B in revenues by 2023. YouTube also makes money with its paid memberships and premium content.
In 2023, Google’s search advertising machine, generated over 175 billion dollars. Whereas Microsoft’s Bing generated 12.2 billion dollars. Thus, as of 2023, Google’s search advertising machine is over 14x larger than Microsoft’s search advertising machine.
Google makes most of its money from advertising. Indeed total advertising revenue represented nearly 78% of Google’s (Alphabet) overall revenues for 2023. Google Search represented nearly 57% of Google’s total revenues. Google generated $307.39B in revenues in 2022, and $73.79B billion in net profits.
In 2023, Google generated $307.39 billion, comprising $175B in Google Search, $31.51B in YouTube ads, and $31.31B in Google network revenue. $34.69B in other revenue, $33B in Google cloud, $1.53B in other bets.
In 2023, Google generated 237.85B in revenue in advertising, which represented over 77% of its total revenues of $ 307.39 B. In 2022, Google generated $224.47B in revenues from advertising, which represented almost 80% of the total revenues, compared to $282.83B in total revenues. Therefore, most of the revenues from Alphabet, the mother company of Google, come from advertising.
At the end of December 2022, Google had over 190,000 employees. On January 20, Google announced the layoff of 12,000 employees within the company, thus bringing the number of total employees by December 2023 to 182,502 full-time employees.
Google generated $1,684,332 per employee in 2023, compared to $1,486,779 per employee in 2022. As of January 2023, as the company announced a mass layoff, it brought back its revenue per employee at $1,586,880, still behind the peak in 2021, for $1,840,330.
Gennaro is the creator of FourWeekMBA, which reached about four million business people, comprising C-level executives, investors, analysts, product managers, and aspiring digital entrepreneurs in 2022 alone | He is also Director of Sales for a high-tech scaleup in the AI Industry | In 2012, Gennaro earned an International MBA with emphasis on Corporate Finance and Business Strategy.