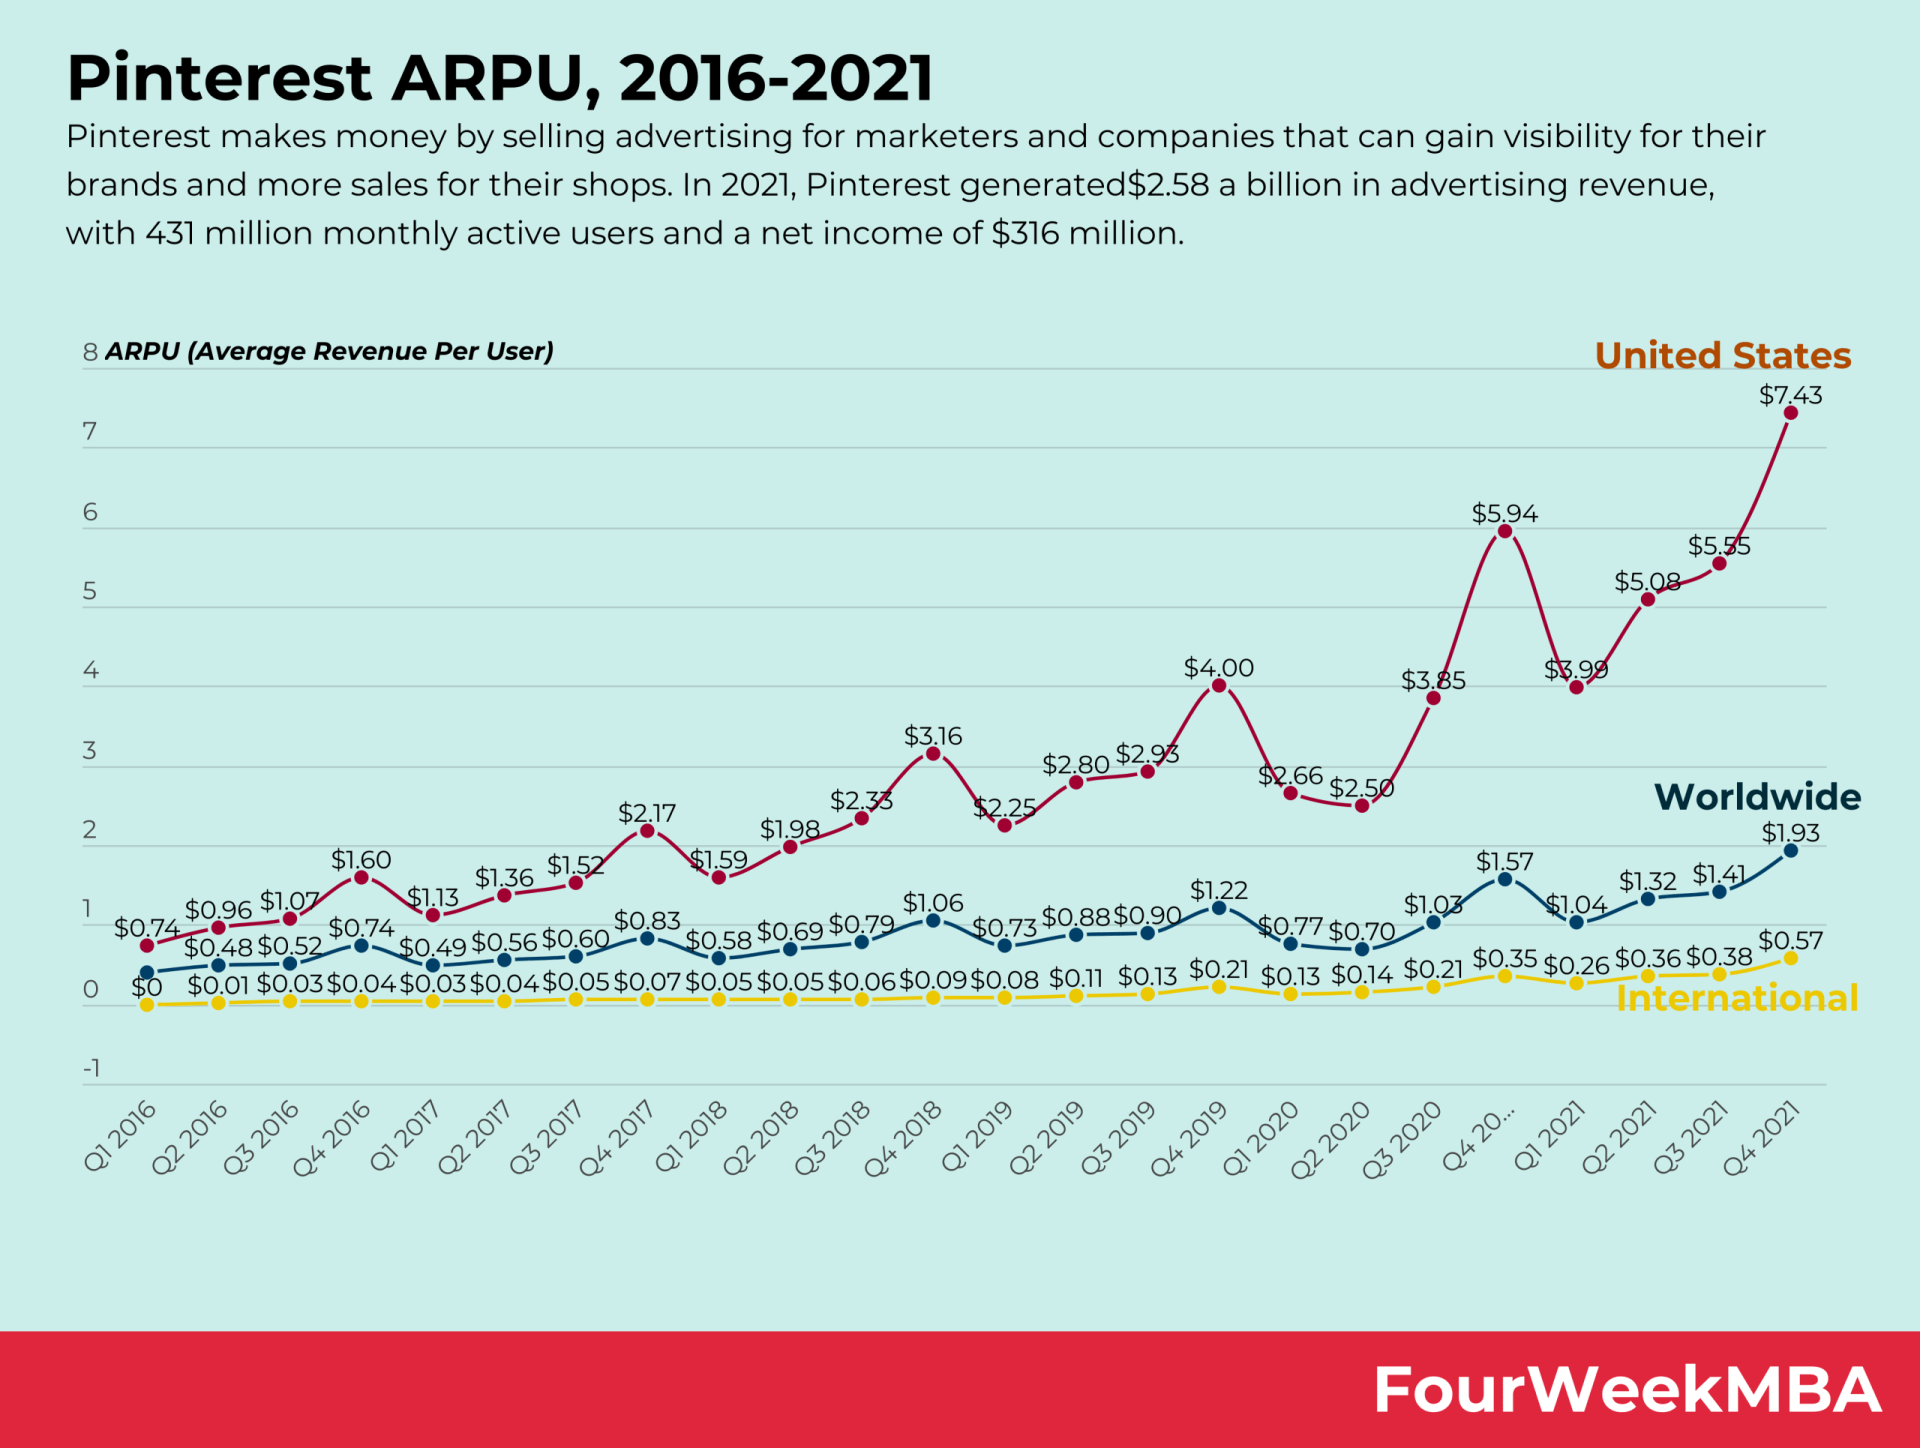
ARPU, or average revenue per user, is a crucial metric for attention merchants like Facebook. It assesses the ability of the platform to monetize its users. For instance, by the end of 2023, Meta’s ARPU worldwide was $13.12. In the US & Canada, it was $68.44; in Europe, it was $23.14; in Asia-Pacific, $5.52; and in the rest of the world, it was $4.50.
Understanding Facebook’s ARPU and why it’s so important to its business model
ARPU, or average revenue per user, is a crucial metric for attention merchants like Facebook. It assesses the ability of the platform to monetize its users. For instance, by the end of 2023, Meta’s ARPU worldwide was $13.12. In the US & Canada, it was $68.44; in Europe, it was $23.14; in Asia-Pacific, $5.52; and in the rest of the world, it was $4.50.
ARPU, or average revenue per user, is a critical measure to assess Facebook’s ability to monetize its users. ARPU is given by total revenue in given geography during a given quarter, divided by the average of the number of monthly active users in the geography at the beginning and end of the quarter.
As specified on Facebook financials: “this is calculated by computing revenue by user geography based on our estimate of the geography in which ad impressions are delivered.“
Important Note: It is important to notice that, as reported on Facebook financials, “ARPU includes all sources of revenue; the number of MAUs used in this calculation only includes users of Facebook and Messenger as described in the definition of MAU above.” That means the metric might be biased in favor of Facebook, as it comprises all the sources of revenues (comprising Instagram and WhatsApp). This implies that in part the monetization ability of Facebook might also be due to the increase in revenues from other platforms such as WhatsApp and Instagram. We can’t know for sure as this is not broken down in Facebook financials.
Why ARPU is a critical metric for Facebook’s financial success
The critical business metrics Facebook tracks comprise:
Daily active users (DAUs): daily active users are defined by Facebook “as a registered Facebook user who logged in and visited Facebook through the website or a mobile device, or used the Messenger application (and is also a registered Facebook user), on a given day.“
Monthly active users (MAUs): monthly active users are defined by Facebook “as a registered Facebook user who logged in and visited Facebook through the website or a mobile device, or used the Messenger application (and is also a registered Facebook user), in the last 30 days as of the date of measurement.“
And average revenue per user (ARPU).
As an attention merchant, Facebook has to make sure to have its users to go back to the platform.
That is also why it is critical to monitor the ARPU to understand how its business model is evolving.
In 2023, Facebook’s ARPU was primarily driven in the US and Canada.
ARPU, or average revenue per user, is a crucial metric for attention merchants like Facebook. It assesses the ability of the platform to monetize its users. For instance, by the end of 2023, Meta’s ARPU worldwide was $13.12. In the US & Canada, it was $68.44; in Europe, it was $23.14; in Asia-Pacific, $5.52; and in the rest of the world, it was $4.50.
This means that Facebook primarily needs to monetize its users in the US and Canada.
How? In several ways. For instance, an increase in ad spending, a larger market base, and better engagement rates of users all affect the ARPU.
Warning: ARPU is not how much your data is worth
It is critical to remark that what Facebook can make of users in terms of monetization doesn’t represent the real value.
In other words, the value of users’ data might be way higher than what Facebook can generate via advertising.
Therefore, it is important not to confuse average revenue per user with the real value of the data behind users, which is another story!
Mark Zuckerberg is the largest shareholder in the company. Zuckerberg retains ownership and control of the company. Like Google, Facebook has issued two common stocks, Class A and Class B. The holders of Class B common stocks are entitled to ten votes per share, and holders of our Class A common stocks are entitled to one vote per share. Mark Zuckerberg has a voting power of 61.1%; he’s the primary decision-maker. Other individual investors comprise Sheryl Sandberg, Christopher Cox, Marc Andreessen, Peter Thiel, Dustin Moskovitz, and Eduardo Saverin.
Facebook, the main product of Meta is an attention merchant. As such, its algorithms condense the attention of over 2.91 billion monthly active users as of June 2021. Meta generated $117.9 billion in revenues, in 2021, of which $114.9 billion from advertising (97.4% of the total revenues) and over $2.2 billion from Reality Labs (the augmented and virtual reality products arm).
Facebook generated most of its revenue from advertising in 2023. Indeed, the company generated $131.95B from advertising, $1.89B billion from its reality labs segment, and over a billion in other revenue.
By September 2022, Facebook’s (Meta) employee count had peaked at 87,314. Yet, as revenue slew down for the first time in years, the company announced a layoff of 13% of its workforce, bringing the headcount to 75,964. By March 2023, Meta announced another round of layoffs, dubbed “The Year of Efficiency,” which brought the headcount down to less than 66 thousand employees. By the end of 2023, Facebook reported 67,317 employees.
In 2022, post layoffs, Facebook generated $1,535,056 per employee, compared to $1,638,586 in 2021. In 2023, as Facebook (now Meta) completed its mass layoffs, the company reported nearly $135 billion in revenue and 67,317 employees, with a $2,003,981 revenue per employee.
Facebook (Meta) gained users in 2023. In fact, in 2023, Facebook had over three billion users worldwide, of which 272 million were in Canada, 408 million were in Europe, over 1.3 billion were in Asia, and over a billion were in the rest of the world.
ARPU, or average revenue per user, is a crucial metric for attention merchants like Facebook. It assesses the ability of the platform to monetize its users. For instance, by the end of 2023, Meta’s ARPU worldwide was $13.12. In the US & Canada, it was $68.44; in Europe, it was $23.14; in Asia-Pacific, $5.52; and in the rest of the world, it was $4.50.
ARPU, or average revenue per user, is a crucial metric for attention merchants like Facebook. It assesses the ability of the platform to monetize its users. For instance, by the end of 2023, Meta’s ARPU worldwide was $13.12. In the US & Canada, it was $68.44; in Europe, it was $23.14; in Asia-Pacific, $5.52; and in the rest of the world, it was $4.50.
Facebook (Meta) revenue in 2023 increased to $134.9B, compared to $116.6B in 2022. Its profitability increased to $39.1B in 2023, compared to $23.2B in 2022 and $39.37B in 2021.
Facebook is characterized by a multi-faceted matrix organizational structure. The company utilizes a flat organizational structure in combination with corporate function-based teams and product-based or geographic divisions. The flat organization structure is organized around the leadership of Mark Zuckerberg, and the key executives around him. On the other hand, the function-based teams based on the main corporate functions (like HR, productmanagement, investor relations, and so on).
Instagram makes money via visual advertising. Acquired by Facebook for a billion-dollar in 2012, today, Instagram is integrated into the overall Facebook (now rebranded as Meta) business strategy. In 2018, Instagram founders Kevin Systrom and Mike Krieger left the company as Facebook pushed toward tighter integration of the two platforms. In 2022, Instagram is the most successful product still, in Meta’s portfolio.
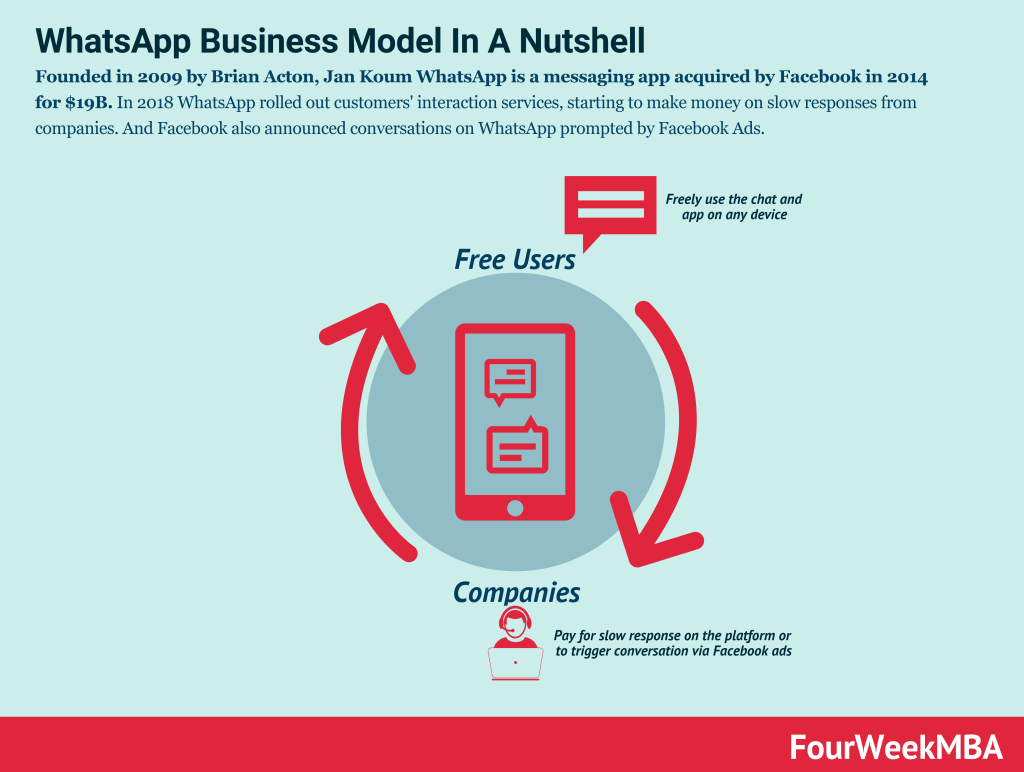
Founded in 2009 by Brian Acton, Jan Koum WhatsApp is a messaging app acquired by Facebook in 2014 for $19B. In 2018 WhatsApp rolled out customers’ interaction services, starting to make money on slow responses from companies. And Facebook also announced conversations on WhatsApp prompted by Facebook Ads.
Frequently Asked Questions
What is The Facebook ARPU Explained?
ARPU, or average revenue per user, is a crucial metric for attention merchants like Facebook. It assesses the ability of the platform to monetize its users. For instance, by the end of 2023, Meta's ARPU worldwide was $13.12. In the US & Canada, it was $68.44; in Europe, it was $23.14; in Asia-Pacific, $5.52; and in the rest of the world, it was $4.50.
What is Facebook's ARPU and why it's so important to its business model?
ARPU, or average revenue per user , is a critical measure to assess Facebook's ability to monetize its users. ARPU is given by total revenue in given geography during a given quarter, divided by the average of the number of monthly active users in the geography at the beginning and end of the quarter.
What is Warning: ARPU is not how much your data is worth?
It is critical to remark that what Facebook can make of users in terms of monetization doesn't represent the real value.
Gennaro is the creator of FourWeekMBA, which reached about four million business people, comprising C-level executives, investors, analysts, product managers, and aspiring digital entrepreneurs in 2022 alone | He is also Director of Sales for a high-tech scaleup in the AI Industry | In 2012, Gennaro earned an International MBA with emphasis on Corporate Finance and Business Strategy.
Scroll to Top
Discover more from FourWeekMBA
Subscribe now to keep reading and get access to the full archive.