Facebook, the main product of Meta, is an attention merchant. As such, its algorithms condense the attention of over three billion monthly active users as of 2023. Meta generated nearly $135 billion in revenues in 2023, of which nearly $132 billion was from advertising (97.8% of the total revenues), $1.9 billion from Reality Labs (the augmented and virtual reality products arm), and over $1 billion in other revenue.
Meta Revenue Breakdown
2023
%
Advertising
$131.95 Billion
97.8%
Other revenue (payments and fees)
$1.06 Million
0.8%
Reality Labs (primarily sales of Oculus, now called Meta Quest)
$1.89 Billion
1.4%
Total
$134,9 Billion
Key Facts
Founders
Mark Zuckerberg, Andrew McCollum, Dustin Moskovitz, Eduardo Saverin, Chris Hughes
Year Founded
February 2004, Cambridge, MA
Date of IPO
May 18, 2012
IPO Price
$38.00
Market Cap at IPO
$104 Billion
Total Revenues at IPO
$3.7 Billion by 2011, prior to the IPO
Total Revenues in 2023
$134,9 Billion
Changed name
Meta, in October 2021
Employees
67,317 employees, globally as of 2023
Revenues per Employee
$2,003,981
Who owns Meta?
Mark Zuckerberg is the primary individual shareholder, with 81.7% of Class B shares, and 52.9% of the total voting power
Facebook’s mission is “to give people the power to build community and bring the world closer together.” As the company rebranded to Meta in 2021, its vision shifted to “helping to bring the metaverse to life.” That implies the company’s effort in the coming years into developing a whole supply chain for the metaverse (hardware, operating system, browser, marketplace).
On the one hand, Meta’s main products (Facebook, Instagram, and Messenger) work as two-sided networks, where for each additional average power user joining (what we call “influencer”) the more the network will become valuable for average users, and the more power users will want to join the platform. On the advertising side, instead, Facebook is an attention marketplace. The more users engage on the platform, the more it becomes valuable for marketers and companies that invest a growing budget on top of the Facebook advertising marketplace (now rebranded as Meta Marketplace).
Distribution Model: Growth Engine (Combining product development/marketing/distribution as a whole), Deal Making, Lobbying.
For the company to keep growing, it needs to keep its user base growing through additional features built into the product, branding campaigns, and the ability to launch new products compelling to younger generations. On the other hand, as social media is under the radar for privacy issues, the company also needs a team of lobbyists to make the company compliant with regulations.
Financial Model: Attention Merchant.
The company monetizes by arbitraging the traffic acquired through its apps resold through its advertising marketplace. As long as the traffic is monetized many times over its acquisition costs, the company is highly profitable.
The history of Facebook: the former rocket ship turned into a heavy cruise ship
Back in the 2010s, a few years after Facebook had been founded, it represented one of the most impressive growth companies that ever existed, also for the Internet standard.
Indeed, Facebook and a few other companies opened the way, to what we call – in hindsight – Web 2.0.
In an early 2004 interview, Mark Zuckerberg, 20 at the time, side by side with WesMatch’s founder, Dan Stillman, explained what Facebook was about. Facebook would eventually wreck down WebMatch and all the other early players in the social network space (Myspace, Friendster, and CampusHook to mention a few).
As Zuckerberg explained it at the time, Facebook was “an online directory that connects people through universities and colleges through their social networks.”
While today we give for granted a Facebook with billions of users, at the time with a hundred thousand users on the platform, it was very hard to tell how big it could become.
Facebook’s early growth trajectory (Source: Financial Prospectus).
When Facebook first launched, it was a rocket ship. The company used a staged rollout, where it would open its app to a larger and large set of users, not gradually, but exponentially.
In short, with its first release, in February 2004, it only proved the concept through Harvard. As growth picked up right on, and the product turned out to be very sticky among students at Harvard, Facebook opened to other top colleges, by the same year.
And this happened right after Facebook had built a very important feature, the Facebook Wall, which would become a place for users to post relevant staff and connect to each other.
This is how Facebook reached a million monthly active users.
After that, by early 2005, Facebook was already present in 800 college networks. By September and October of the same year, Facebook expanded to high schools and international networks. This, at the moment in which, it had introduced a new feature, photos, enabling users to upload their photos on the platform (a big deal at the time!).
By 2005, Facebook had reached 6 million monthly active users (a 6x growth).
By September 2006, Facebook introduced another key feature, which was as powerful as the “Stories feature” that Snapchat would introduce seven years later, in 2013. That was Facebook’s News Feed!
By 2006, Facebook had grown into a 12 million monthly active user base.
By 2007, Facebook launched the Facebook Platform, a third-party application platform, enabling developers to build apps/features on top of Facebook. While this would be slowly shut down over the years (Facebook deprecated various APIs over time) it was a great experimental platform for quick users growth.
In the same year, also Facebook Pages was launched. The company reached 58 monthly active users.
In 2008-2009 Facebook’s expansion continued, with Facebook reaching over 360 million monthly active users.
In the same year, 2009, Facebook introduced the like button.
By 2012, as Facebook got ready for the IPO, it also reached a billion monthly active users!
And as it grew, it also played with its privacy policies, to make its advertising machine extremely profitable (a blessing and a curse that would follow the company for years).
Leveraging a powerful social graph, it leveraged network effects, and it quickly grew, from a social network for universities, to mass social media company.
The Facebook Social Graph of the early days! (Source: Facebook Prospectus).
Facebook was an incredible innovation for its time. With a very simple interface — as explored in the interface layer wars reshaping consumer tech — users could upload photos, update their status, and send messages to their friends and have complete control over what they wanted to share:
(Source: Facebook Prospectus).
Back then, when Facebook was getting ready for its IPO, Zuckerberg highlighted the company’s playbook, founded on what Zuck called “The Hacker Way” (which also turned into the name of the street – 1 Hacker Way, Menlo Park – where the main headquarter is situated).
This playbook would also become the standard, for those building Internet companies who had to leverage fast users’ adoption, and network effects.
It would inspire disciplines like growth hacking, and growthmarketing, now become a standard in the Internet industry.
The manifesto said:
As part of building a strong company, we work hard at making Facebook the best place for great people to have a big impact on the world and learn from other great people. We have cultivated a unique culture and management approach that we call the Hacker Way
The word “hacker” has an unfairly negative connotation from being portrayed in the media as people who break into computers. In reality, hacking just means building something quickly or testing the boundaries of what can be done. Like most things, it can be used for good or bad, but the vast majority of hackers I’ve met tend to be idealistic people who want to have a positive impact on the world.
Therefore, Zuckerberg reframed the meaning of hacker, not as something bad, but rather a mindset to be used to build valuable things in the world.
And he continued:
The Hacker Way is an approach to building that involves continuous improvement and iteration. Hackers believe that something can always be better, and that nothing is ever complete. They just have to go fix it — often in the face of people who say it’s impossible or are content with the status quo.
This would set the stage for the core mindset that Facebook had led for years of “moving fast, and breaking things.” This would be the main manifesto for years until Facebook had become such a popular company, that going too fast was no longer an option.
Indeed, in 2014, as Facebook had become a company generating over $12 billion in advertising revenues, and with almost 1.4 billion Monthly Active Users, the motto changed to “Move fast with stable infrastructure — as explored in the economics of AI compute infrastructure — .”
However, like Zuckerberg, explained, back in 2012 – when Facebook was getting ready for the IPO:
Hackers try to build the best services over the long term by quickly releasing and learning from smaller iterations rather than trying to get everything right all at once. To support this, we have built a testing framework that at any given time can try out thousands of versions of Facebook. We have the words “Done is better than perfect” painted on our walls to remind ourselves to always keep shipping.
He also added:
Hacking is also an inherently hands-on and active discipline. Instead of debating for days whether a new idea is possible or what the best way to build something is, hackers would rather just prototype something and see what works. There’s a hacker mantra that you’ll hear a lot around Facebook offices: “Code wins arguments.”
What about its culture?
Hacker culture is also extremely open and meritocratic. Hackers believe that the best idea and implementation should always win — not the person who is best at lobbying for an idea or the person who manages the most people.
How did Facebook incentivize this hacker mindset?
To encourage this approach, every few months we have a hackathon, where everyone builds prototypes for new ideas they have. At the end, the whole team gets together and looks at everything that has been built. Many of our most successful products came out of hackathons, including Timeline, chat, video, our mobile development framework and some of our most important infrastructure like the HipHop compiler.
This implied an initial program, a Bootcamp, which anyone (also future managers) had to go through:
To make sure all our engineers share this approach, we require all new engineers — even managers whose primary job will not be to write code — to go through a program called Bootcamp where they learn our codebase, our tools and our approach. There are a lot of folks in the industry who manage engineers and don’t want to code themselves, but the type of hands-on people we’re looking for are willing and able to go through Bootcamp.
In 2012, Facebook had reached over $5 billion in revenues. By 2016, that number would be more than 5x, reaching over $27 billion in revenues.
And by 2021, Facebook 4xed again its growth to $114.9 Billion in advertising revenues!
Facebook, metaverse, and rebranding as Meta
At the end of October 2021, Mark Zuckerberg announced the Facebook Inc. rebrand as Meta. A company focused and dedicated to building the Metaverse. Beyond buzzwords and corporate communication. What does that imply?
With the announcement, Facebook changed its name to Meta. It wasn’t just a name change (although it was perceived by many as such) but it also worked as organizational restructuring.
Indeed, with this move, Facebook, now Meta, wanted to show its bold move into VR/AR, which is seen by Zuckerberg as the next mass consumer platform after the smartphone.
In short, with this new organization, they are trying to go after, what today we call the Metaverse, which is something still hard to make sense of since its definition is being shaped now.
Thus, Facebook, now Meta, is trying to become a leading player in this new market. But to really understand that we need to look at the overall Facebook business model.
Before we get to that, it’s important to emphasize that Meta is still an advertising company. And how do you measure the success of an advertising company? There is a metric for that: ARPU!
It’s all about ARPU: How much are you worth to Facebook?
ARPU, or average revenue per user, is a crucial metric for attention merchants like Facebook. It assesses the ability of the platform to monetize its users. For instance, by the end of 2023, Meta’s ARPU worldwide was $13.12. In the US & Canada, it was $68.44; in Europe, it was $23.14; in Asia-Pacific, $5.52; and in the rest of the world, it was $4.50.
ARPU stands for average revenue per user. In short, how much money a company can get on average from each user?
In the Facebook case, we can take into account the monthly active users.
For a company like Facebook, for which over 97% of its revenues come from advertising the amount of time people spend on the so-called news feed is crucial to increase the profitability metrics of the company.
If you think about Google, what makes the company able to monetize its users is not necessarily how much time they spend on the search results pages. Instead, that is based on how fast users can find what they need.
Yet as of now the more time you spend on Facebook and the more you’re active on it, the more you allow it to make money.
What else? Not all users are born equal. In fact, according to the geography and the ad market of each country, the monetization strategy changes.
ARPU, or average revenue per user, is a crucial metric for attention merchants like Facebook. It assesses the ability of the platform to monetize its users. For instance, by the end of 2023, Meta’s ARPU worldwide was $13.12. In the US & Canada, it was $68.44; in Europe, it was $23.14; in Asia-Pacific, $5.52; and in the rest of the world, it was $4.50.
For instance, that is how much each user based on geography was worth to Facebook in 2023:
US and Canada: $68.44.
Europe: $17.29.
Asia: $4.61.
Rest of the World: $13.12.
Therefore, a user from the US or Canada as of 2023 is worth more than a user from Europe or the Asia-Pacific region. To make a comparison, a user from the US and Canada, on average, is worth nearly 4x more than a user in the rest of the world!
Of course, also within the US, there are the so-called power users, who are worth way more to the company.
For instance, think of an influencer profile, that has many millions of followers, and that when it posts, generates millions of interactions.
If you take, for instance, the most successful Instagram account in 2024, that of Cristiano Ronaldo, with over 600 million followers, you realize that this account alone might be worth hundreds of millions for the company, each year.
Compared to the account of average users, with a few followers, which generates very few engagements. Thus, when looking at ARPU, it’s important not to give it too much weight.
An analysis based on power users’ accounts and how those power users (like Cristiano Ronaldo) move their following across various social media platforms (imagine Ronaldo stopped posting on Instagram and only posted on TikTok) can tell us much more about the overall health of the platform user adoption.
This, of course, is a qualitative analysis.
From an internal standpoint, the long-term objective for Facebook is to keep increasing its monetization for each user, especially in the developing parts of the world where there is still space to grow the user base, which instead has stalled in the US and Canada.
At the same time, it needs to make sure to keep growing its user base and keep attracting power users, which can generate millions of interactions with each post. And this is a matter of product development, engineering, distribution, and brand appeal to newer generations!
Facebook (Meta) gained users in 2023. In fact, in 2023, Facebook had over three billion users worldwide, of which 272 million were in Canada, 408 million were in Europe, over 1.3 billion were in Asia, and over a billion were in the rest of the world.
If we look at the current landscape of Facebook’s monthly active users (this only comprises Facebook users), we can see how growth in US & Canada has mostly slowed down.
Snapshot of Facebook key stats and facts
As reported officially by Facebook, the company’s main headquarter is situated at 1 Hacker Way, Menlo Park, California 94025.
The company also reported over 3 billion monthly active users (remember that Facebook Inc., also comprises other products like Instagram, while they affect the Facebook bottom line, Facebook doesn’t report how much of it is coming from each product and doesn’t tell us the users count of those platforms).
In 2023 Facebook, now Meta, generated nearly $135 billion in revenues.
In 2023 Meta’s business model was driven by advertising revenues, which represented 97.8% of the total revenues.
Advertising (over 97.8% of revenues): the company generated over $131 billion in advertising, primarily consisting of displaying ad products on Facebook, Instagram, Messenger, and third-party. As Facebook highlighted, in 2023, the number of ads delivered increased by 28%, as compared with approximately 18% in 2022. The price per ad decreased by 9% in 2023, compared to a 16% decrease in 2022. This happened due to the fact that Meta has been pushing formats (like Reels) that while grabbing more attention are also hard to monetize (for now) due to the format and geography.
Payments and other fees (less than 1% of total revenues): those revenues primarily consisted of the net fee received from developers using Payments infrastructure or revenue from the delivery of virtual reality platform devices and, most importantly, revenue from the delivery of consumer hardware devices.
Reality Labs generated nearly $2 billion in revenues (less than 2% of the total revenues) from the delivery of consumer hardware products, such as Meta Quest (former Oculus), Facebook Portal, wearables, and related software and content.
Facebook’s same mission statement, changed vision (hint: it’s all about the metaverse)
The company’s mission was “to give people the power to build community and bring the world closer together.”
As Facebook, became Meta, its mission statement stayed the same, however, its vision changed.
In fact, Meta’s mission is still to give people the power to build community and bring the world closer together.
The vision is “of helping to bring the metaverse to life.”
As the company highlighted in its 2021 financials:
We build technology that helps people connect, find communities, and grow businesses. Our useful and engaging products enable people to connect andshare with friends and family through mobile devices, personal computers, virtual reality (VR) headsets, wearables, and in-home devices. We also help peoplediscover and learn about what is going on in the world around them, enable people to share their opinions, ideas, photos and videos, and other activities withaudiences ranging from their closest family members and friends to the public at large, and stay connected everywhere by accessing our products. Meta is movingbeyond 2D screens toward immersive experiences like augmented and virtual reality to help build the metaverse, which we believe is the next evolution in socialtechnology
Family of Apps (comprising the main products which make the advertising business successful – like Facebook, Instagram, Messenger, WhatsApp).
And Reality Labs: the suite of products related to the Metaverse (former Oculus, wearables, and marketplaces related to VR/AR).
And five main product pillars:
Facebook, which main digital assets comprise the News Feed, Stories, Groups, Watch, Marketplace, Reels, Dating.
Instagram, which main digital assets comprise Instagram Feed, Stories, Reels, Video, Live, Shops, and messaging.
Messenger, which main features comprise chat, audio and video calls, and Rooms.
WhatsApp which main application is mobile chat.
And Meta Quest is the company’s flagship hardware for virtual reality on top of which Meta is trying to build its new supply chain of data.
And a “research factory”, which is Reality Labs, trying to build from scratch the whole Metaverse supply chain!
Facebook Reality Labs is an augmented and virtual reality laboratory that produces hardware and consumer devices. This is comprised of Oculus, a leader in VR headsets, which Facebook acquired in 2014 for $2.3 billion. Oculus Quest, the main product line of what has been rebranded as Facebook Reality Labs is the VR device, which will also play a key role in the development of the Metaverse.
We’ll see why the Metaverse plays such a key role in Facebook’s future. And it’s all about distribution.
Comparing the attention merchants’ business models
In an asymmetric business model, the organization doesn’t monetize the user directly, but it leverages the data users provide coupled with technology, thus having a key customer pay to sustain the core asset. For example, Google makes money by leveraging users’ data, combined with its algorithms sold to advertisers for visibility. This is how attention merchants make monetize their business models.
Before we jump forward, to understand Facebook’s fast move into the Metaverse. Let’s highlight some core similarities, and differences between Google and Facebook business models.
Let’s see two major similarities:
Both Facebook (rebranded as Meta) and Google (rebranded as Alphabet), try to move away (or apparently do so) from ads, still making the most of their revenues from it. In 2021, Alphabet generated over $209 billion or over 81% of its total revenues from ads. Meta generated running on ads, primarily. Meta generated $114.9 billion or over 97% of its total revenues from ads! True, both companies are betting and investing in other areas, but that is where most revenues, at extremely high margins are generated.
Both are asymmetric business models. As I explain here, asymmetric business models, work by offering a free, incredible tool/service/application, to users, at scale. While this is apparently free, the same free users represent the main asset for the company. Therefore, both Facebook and Google, 1. monetize their users’ traffic via advertising2. are able to profit from users’ data, way more than the value of the data for a single user (thanks to network effects). Thus, the data is much more valuable to Google/Facebook in their advertising marketplace, than to a single user 3. the way Google/Facebook can leverage the data is asymmetric, as they get two companies that combined are worth trillions, and the free user on the other side gets either easy to find information (Google) or entertainment/connection (Facebook). Worth highlighting also how benefits for society are created when more and more users freely use these applications at scale. However, also negative externalities arise (which are not accounted for in these companies’ balance sheets), which are carried by the collective.
Yet, similarities stop here, in fact, these two business models are fundamentally different, because:
Search is a different mechanism than social media: in fact, where the search is a “pull mechanism” where users are looking for something, expressing their intent directly through search, social media is a “push communication mechanism,” where information is mostly shown in the news feed. Thus, the main effort for Facebook is to make sure this news feed stays relevant.
Google is vertically integrated: Facebook primarily relies on its brand, and product to make sure its apps are easy to be found through Apple and Google mobile pipelines. However, where Google controls the operating system (Android), browser (Chrome), marketplace (Google Play), and some of the applications (like Google search), Facebook only has its brands. This means that if Google and Apple (as it happened already) were to unilaterally change their rules, this would affect the overall Facebook business model.
The advertising marketplace: since Google primarily sells search ads the main effort for the company is to guess what’s the real intent behind the search. For Facebook instead, it’s all about micro-targeting the users, by knowing all their preferences. While the Facebook Advertising machine is much simpler to use and understand, the Google advertising machine has more subtleties to grasp.
Now that we clarified these distinctions, we can move to the Metaverse!
Facebook moves into the Metaverse!
The Facebook business model is quite simple: advertising. Even though there are two sources of income, most of the revenue comes from ads.
I wouldn’t be surprised to see the other sources of income, other than advertising, grow in the next years. That is good to diversify the revenue stream.
However, as of now, the company’s growth is tied to its ability to engage its daily active users.
Some users (for instance, North America and Europe) are worth more on Facebook because those areas are monetized differently. Also, there is one key metric that tells us if the value of Facebook will keep growing in the long run: ARPU.
As we saw, Facebook, together with Google, is the most profitable attention merchant. The company has emulated successfully the Google advertising machine.
With a couple of slight differences to emphasize.
First, Facebook’s ads are pushed to the users via targeting, wherein Google’s case these ads are pushed based on contextual search. Second, where Google’s distribution passes through ownership of hardware (Google manufactures the Pixel), browser (Google owns Chrome), mobile operating system (Google runs Android), and search. Thus, Google (Alphabet) is way more vertically integrated:
Facebook’s distribution is primarily based on strong brand names. With the acquisitions of Instagram, WhatsApp, and Oculus, Facebook has kept a strong distribution, yet primarily based on the strength of these brands.
Thus, from here we can really really explain the swift move that Facebook made into the Metaverse.
We can argue that Mark Zuckerberg’s Meta is in a Blitzscaling mode. Where it’s both trying to defend its business model, and attack the market, by creating a whole new industry, potentially bigger than mobile.
To understand this, we need to look at Apple’s privacy update on mobile devices.
Apple’s privacy change
The triggering move to Facebook’s rebrand has been the survival threat posed by Apple to the entire Facebook business model. In January 2021, Apple announced the “Data Privacy Day” where it explained:
“A Day in the Life of Your Data” helps users better understand how third-party companies track their information across apps and websites, while describing the tools Apple provides to make tracking more transparent and give users more control. The explainer sheds light on how widespread some of these practices have become. On average, apps include six “trackers” from other companies, which have the sole purpose of collecting and tracking people and their personal information.Data collected by these trackers is pieced together, shared, aggregated, and monetized, fueling an industry valued at $227 billion per year.
App privacy nutrition lab, by Apple (Source: Apple).
This was just another of the steps Apple had taken to completely rehaul the digital advertising industry. In fact, Apple started to roll out a new default mode for privacy on its mobile devices. Where it showed users a clear statement where it said“Facebook would like permission to track you across apps and websites owned by other companies.”
This led and it’s leading many users to opt-out of mobile tracking and therefore advertising. Potentially creating a negative impact on the whole Facebook ecosystem.
The Metaverse Supply Chain
In 2021, Founder’s letter Mark Zuckerberg highlighted:
We are at the beginning of the next chapter for the internet, and it’s the next chapter for our company too.
In recent decades, technology has given people the power to connect and express ourselves more naturally. When I started Facebook, we mostly typed text on websites. When we got phones with cameras, the internet became more visual and mobile. As connections got faster, video became a richer way to share experiences. We’ve gone from desktop to web to mobile; from text to photos to video. But this isn’t the end of the line.
The next platform will be even more immersive — an embodied internet where you’re in the experience, not just looking at it. We call this the metaverse, and it will touch every product we build.
And he continued:
In the metaverse, you’ll be able to do almost anything you can imagine — get together with friends and family, work, learn, play, shop, create — as well as completely new experiences that don’t really fit how we think about computers or phones today. We made afilm that explores how you might use the metaverse one day.
Facebook, now Meta emphasized its role in this development as:
Our role in this journey is to accelerate the development of the fundamental technologies, social platforms and creative tools to bring the metaverse to life, and to weave these technologies through our social media apps. We believe the metaverse can enable better social experiences than anything that exists today, and we will dedicate our energy to helping achieve its potential.
These statements which sound inspirational are actually explaining the long-term survival threat posed to Facebook, the rebrand as Meta, and its long-term success, achievable if Facebook managed to build the Metaverse!
What can you do in the Metaverse (for now)?
While Facebook’s vision for the Metaverse is limited for now, this might comprise various business worlds, domains, and ecosystems. In fact, Metaverse is a term that comprises VR/AR, crypto, and more.
Yet, In Facebook’s Meta vision, the Metaverse will have a few key killer features like gaming, fitness, and more:
Horizon Home
Messengers’ calls in VR
Work and Productivity
Key Highlights
Facebook was founded in 2004 by Mark Zuckerberg in his dorm room at Harvard. Since then the company has never stopped growing. If it were a country, Facebook would probably be the most crowded on earth. However, the ability of the company to increase its value over time is based on how much money on average can make for each user.
Over 97% of Facebook’s revenues come from advertising. Therefore, unless things will change; the news feed is still the primary driver for monetizing Facebook’s content. A simple change in its algorithm can influence the mood of billions of people. Also, it can affect the value of the company by billions of dollars.
Facebook swiftly moved into the Metaverse, as Apple’s privacy changes also threatened the company’s long-term survival. That is why Facebook, now Meta is committed to building the so-called Metaverse.
Key conclusions
Though Meta claims to move toward the Metaverse, advertising through Facebook/Instagram is still the primary driver.
While Facebook has kept growing in areas of the world like Asia and the rest of the world, its monetization and ARPU are still primarily tied to the US & Canada, which, in 2021 represented over 43% of the total revenues.
In 2021, ARPU was $11.57 worldwide. While in US & Canada it was $60.57, in Europe it was $19.68, in Asia $4.89 and in the rest of the world, it was $3.43. This shows the great discrepancy inability to monetize the traffic in North America and Europe vs. other areas of the world.
Most advertising revenues still come from mobile and from the main product: Instagram.
Meta managed to increase substantially its revenues in 2021, primarily thanks to the number of ads delivered, which increased by 10% (compared to approximately 34% in 2020). The primary ad revenue driver was the price per ad increase of 24% in 2021 ( compared to a 5% decrease in 2020). This metric is extremely important as it shows that Facebook is squeezing users’ attention to drive up revenues.
Reality Labs sales were primarily driven by Meta Quest (former Oculus), which turned out to be a great VR gaming console. Will it be able to make the jump and become the primary device for content creation, and consumption in virtual reality? That’s an open question.
While other tech giants like Google and Apple are vertically integrated and control the whole supply chain of data. In fact, Apple runs iOS operating system on the iPhone and the Apple Store. While Google runs the Android operating system on Android Devices, and the Google Play marketplace on top of these devices. These are the mobile distribution pipelines that enable apps, like Facebook & Instagram to be experienced by billions of users.
While Facebook’s family of apps still enjoys strong brands, thus, making it hard for companies like Apple and Google (which control the mobile distribution pipelines) to block users’ growth for the company. These companies can still affect negatively the Meta advertising machine, as they can change the rules of how users need to approve personalized advertising – unilaterally.
While there is no clear sign of slowed revenues for Meta, in 2021. It’s worth emphasizing how the company kept growing its revenues by increasing the cost of advertising substantially (not a viable strategy in the long term).
In addition, the company expects a substantial slow-down in 2022, as the effect of Apple’s privacy policy changes (users have to opt-in explicitly to targeted ads). In fact, Meta’s CFO has already announced a substantial – expected – decrease in profitability for the company in 2022.
This means, that the move to the metaverse, for Facebook (now Meta) isn’t just a strategic move. That is a survival move! Where Facebook hasn’t integrated its supply chain over the years, primarily relying on third-party marketplaces (Apple Store and Google Play), to make its business model survive in the long-term, the company will need to build the hardware, operating system, software, and marketplace that might power up the next generation of mass consumer devices!
What organizational structure does Facebook run?
Facebook is characterized by a multi-faceted matrix organizational structure. The company utilizes a flat organizational structure in combination with corporate function-based teams and product-based or geographic divisions. The flat organization structure is organized around the leadership of Mark Zuckerberg, and the key executives around him. On the other hand, the function-based teams are based on the main corporate functions (like HR, product management, investor relations, and so on).
Is Facebook an important player in the digital advertising industry?
Facebook products come only after Google, in terms of revenue generation. Indeed, Facebook is among the largest digital advertising player, which generated nearly $114 billion in advertising revenues, in 2022.
However, an important note here is that players like Amazon, and TikTok are growing very rapidly.
In addition to that, also Apple has built its advertising segment, and it has huge growth potential, given the fact, that the company controls the mobile pipeline (although Apple might want to keep that as hidden as possible, as it would in part conflict with its value proposition).
Also, Amazon has a growing advertising business, which has the potential to become as big, or close, to that of Google and Facebook in the coming years.
Lastly, but also very important, TikTok’s advertising revenues are growing very quickly, thus posing a threat to the Google-Facebook duopoly.
In short, the digital advertising industry, which has been mostly resegmented around Google and Facebook, is now opening up to new competitors, that have the firepower to take over important market shares from the incumbent.
Business Model Element
Analysis
Implications
Examples
Value Proposition
Facebook’s value proposition is built on several key elements: – Social Networking: Provides a platform for connecting with friends and family. – Content Sharing: Allows users to share photos, videos, and updates. – Communication: Facilitates real-time messaging and voice/video calls. – Marketplace: Offers a platform for buying and selling items locally. – Advertising: Enables targeted advertising for businesses. Facebook enhances connectivity, content sharing, communication, e-commerce, and advertising opportunities for its users.
Offers a comprehensive social networking experience. Provides tools for content sharing, communication, and e-commerce. Enables businesses to reach a targeted audience through advertising. Enhances user engagement and interaction. Attracts users seeking various online activities and connections.
– Connecting with friends and family through social networking. – Sharing photos, videos, and updates with the community. – Facilitating real-time messaging and voice/video calls. – Buying and selling items locally through the Marketplace. – Businesses reaching a targeted audience through advertising. – Attracting users seeking diverse online activities and connections.
Customer Segments
Facebook serves diverse customer segments, including: 1. Individuals: People looking to connect with friends and family. 2. Businesses: Companies using Facebook for advertising and brand promotion. 3. Content Creators: Users sharing content to a wide audience. 4. Marketers: Professionals utilizing Facebook for marketing campaigns. Facebook caters to various user types and industries, expanding its user base and advertising revenue.
Provides a platform for personal connections and networking. Offers advertising solutions for businesses to reach potential customers. Supports content creators in sharing content with a wide audience. Attracts marketers seeking advertising opportunities and campaign management tools. Diversifies its offerings to accommodate various users and industries.
– Supporting personal connections and networking. – Offering advertising solutions for businesses. – Supporting content creators in sharing content. – Attracting marketers seeking advertising opportunities. – Diversifying offerings for various users and industries.
Distribution Strategy
Facebook’s distribution strategy includes several key components: – Online Platform: Provides a user-friendly website and mobile app. – Global Reach: Offers services worldwide, reaching a vast user base. – Mobile Focus: Prioritizes mobile accessibility and app development. – Partnerships: Collaborates with businesses and developers for integration. Facebook ensures accessible and user-friendly access to its platform, operates globally, focuses on mobile accessibility, and collaborates with partners for service integration.
Offers accessible access through its website and mobile app. Reaches a vast global user base through worldwide operations. Prioritizes mobile accessibility for user convenience. Collaborates with partners for integrated services. Emphasizes accessibility, global reach, and user engagement through distribution channels.
– Providing accessible access through the website and mobile app. – Reaching a vast global user base through worldwide operations. – Prioritizing mobile accessibility for user convenience. – Collaborating with partners for integrated services. – Emphasizing accessibility, global reach, and user engagement in distribution.
Revenue Streams
Facebook generates revenue from various sources: 1. Advertising: Earns income from businesses running ads on the platform. 2. Virtual Goods: Sells virtual items in games and apps. 3. Marketplace: Charges fees for selling products. 4. Oculus: Generates income from virtual reality products. 5. Data Licensing: Sells user data to third-party companies. Facebook primarily relies on advertising revenue but also earns income from virtual goods, marketplace fees, Oculus sales, and data licensing.
Relies on advertising as the primary source of revenue. Monetizes virtual goods in games and apps. Charges fees for product sales in the Marketplace. Generates income from Oculus virtual reality products. Sells user data to third-party companies. Diversifies income sources for financial stability.
– Earnings from advertising by businesses. – Monetizing virtual goods in games and apps. – Charging fees for product sales in the Marketplace. – Generating income from Oculus virtual reality products. – Selling user data to third-party companies. – Diversifying income sources for financial stability.
Marketing Strategy
Facebook’s marketing strategy focuses on the following elements: – User Engagement: Encourages user interaction and content sharing. – Advertising: Promotes targeted advertising solutions for businesses. – User Data: Utilizes user data for personalized content and ads. – Partnerships: Collaborates with brands for co-branded content and campaigns. Facebook promotes user engagement, advertising opportunities, personalized content, and partnerships to attract and retain users and businesses.
Attracts users by encouraging interaction and content sharing. Offers advertising solutions for businesses to reach their target audience. Enhances user satisfaction through personalized content and ads. Collaborates with brands for mutual promotion and campaigns. Prioritizes elements that enhance user acquisition and retention.
– Encouraging user interaction and content sharing. – Promoting targeted advertising solutions for businesses. – Utilizing user data for personalized content and ads. – Collaborating with brands for mutual promotion. – Prioritizing elements that enhance user acquisition and retention.
Organization Structure
Facebook’s organizational structure includes: – CEO and Leadership Team: Led by the CEO responsible for strategic direction. – Product Development: Focuses on platform and feature development. – Business Operations: Manages advertising, partnerships, and sales. – User Data Protection: Ensures user data privacy and security. – Research and Innovation: Drives technological advancements. Facebook’s structure emphasizes product development, business operations, user data protection, and innovation.
Led by a CEO responsible for strategic direction and decision-making. Divides operations into specialized functions for efficiency. Prioritizes product development and technological innovation. Manages advertising, partnerships, and sales for revenue generation. Ensures user data privacy and security as a priority. Supports Facebook’s strategic goals and industry leadership.
– Led by a CEO for strategic direction and decision-making. – Dividing operations into specialized functions for efficiency. – Prioritizing product development and technological innovation. – Managing advertising, partnerships, and sales for revenue generation. – Ensuring user data privacy and security as a priority. – Supporting strategic goals and industry leadership.
Competitive Advantage
Facebook’s competitive advantage arises from: – Large User Base: Boasts over 2 billion monthly active users. – Data Insights: Utilizes user data for personalized experiences and ads. – Advertising Dominance: Leads the digital advertising market. – Platform Integration: Integrates various apps and services. – Global Reach: Operates worldwide, reaching diverse markets. Facebook distinguishes itself with its vast user base, data-driven insights, advertising dominance, platform integration, and global presence.
Attracts a diverse user base with over 2 billion monthly active users. Enhances user engagement through personalized experiences and targeted ads. Dominates the digital advertising market, attracting businesses. Provides integrated services through various apps. Reaches global markets with worldwide operations. Maintains a strong competitive position in the social media and advertising industries.
– Boasting over 2 billion monthly active users. – Utilizing user data for personalized experiences and ads. – Leading the digital advertising market. – Integrating various apps and services for user convenience. – Operating worldwide and reaching diverse markets. – Maintaining a strong competitive position in social media and advertising.
Mark Zuckerberg is the largest shareholder in the company. Zuckerberg retains ownership and control of the company. Like Google, Facebook has issued two common stocks, Class A and Class B. The holders of Class B common stocks are entitled to ten votes per share, and holders of our Class A common stocks are entitled to one vote per share. Mark Zuckerberg has a voting power of 61.1%; he’s the primary decision-maker. Other individual investors comprise Sheryl Sandberg, Christopher Cox, Marc Andreessen, Peter Thiel, Dustin Moskovitz, and Eduardo Saverin.
Facebook, the main product of Meta is an attention merchant. As such, its algorithms condense the attention of over 2.91 billion monthly active users as of June 2021. Meta generated $117.9 billion in revenues, in 2021, of which $114.9 billion from advertising (97.4% of the total revenues) and over $2.2 billion from Reality Labs (the augmented and virtual reality products arm).
Facebook generated most of its revenue from advertising in 2023. Indeed, the company generated $131.95B from advertising, $1.89B billion from its reality labs segment, and over a billion in other revenue.
By September 2022, Facebook’s (Meta) employee count had peaked at 87,314. Yet, as revenue slew down for the first time in years, the company announced a layoff of 13% of its workforce, bringing the headcount to 75,964. By March 2023, Meta announced another round of layoffs, dubbed “The Year of Efficiency,” which brought the headcount down to less than 66 thousand employees. By the end of 2023, Facebook reported 67,317 employees.
In 2022, post layoffs, Facebook generated $1,535,056 per employee, compared to $1,638,586 in 2021. In 2023, as Facebook (now Meta) completed its mass layoffs, the company reported nearly $135 billion in revenue and 67,317 employees, with a $2,003,981 revenue per employee.
Facebook (Meta) gained users in 2023. In fact, in 2023, Facebook had over three billion users worldwide, of which 272 million were in Canada, 408 million were in Europe, over 1.3 billion were in Asia, and over a billion were in the rest of the world.
ARPU, or average revenue per user, is a crucial metric for attention merchants like Facebook. It assesses the ability of the platform to monetize its users. For instance, by the end of 2023, Meta’s ARPU worldwide was $13.12. In the US & Canada, it was $68.44; in Europe, it was $23.14; in Asia-Pacific, $5.52; and in the rest of the world, it was $4.50.
ARPU, or average revenue per user, is a crucial metric for attention merchants like Facebook. It assesses the ability of the platform to monetize its users. For instance, by the end of 2023, Meta’s ARPU worldwide was $13.12. In the US & Canada, it was $68.44; in Europe, it was $23.14; in Asia-Pacific, $5.52; and in the rest of the world, it was $4.50.
Facebook (Meta) revenue in 2023 increased to $134.9B, compared to $116.6B in 2022. Its profitability increased to $39.1B in 2023, compared to $23.2B in 2022 and $39.37B in 2021.
Facebook is characterized by a multi-faceted matrix organizational structure. The company utilizes a flat organizational structure in combination with corporate function-based teams and product-based or geographic divisions. The flat organization structure is organized around the leadership of Mark Zuckerberg, and the key executives around him. On the other hand, the function-based teams based on the main corporate functions (like HR, product management, investor relations, and so on).
Instagram makes money via visual advertising. Acquired by Facebook for a billion-dollar in 2012, today, Instagram is integrated into the overall Facebook (now rebranded as Meta) business strategy. In 2018, Instagram founders Kevin Systrom and Mike Krieger left the company as Facebook pushed toward tighter integration of the two platforms. In 2022, Instagram is the most successful product still, in Meta’s portfolio.
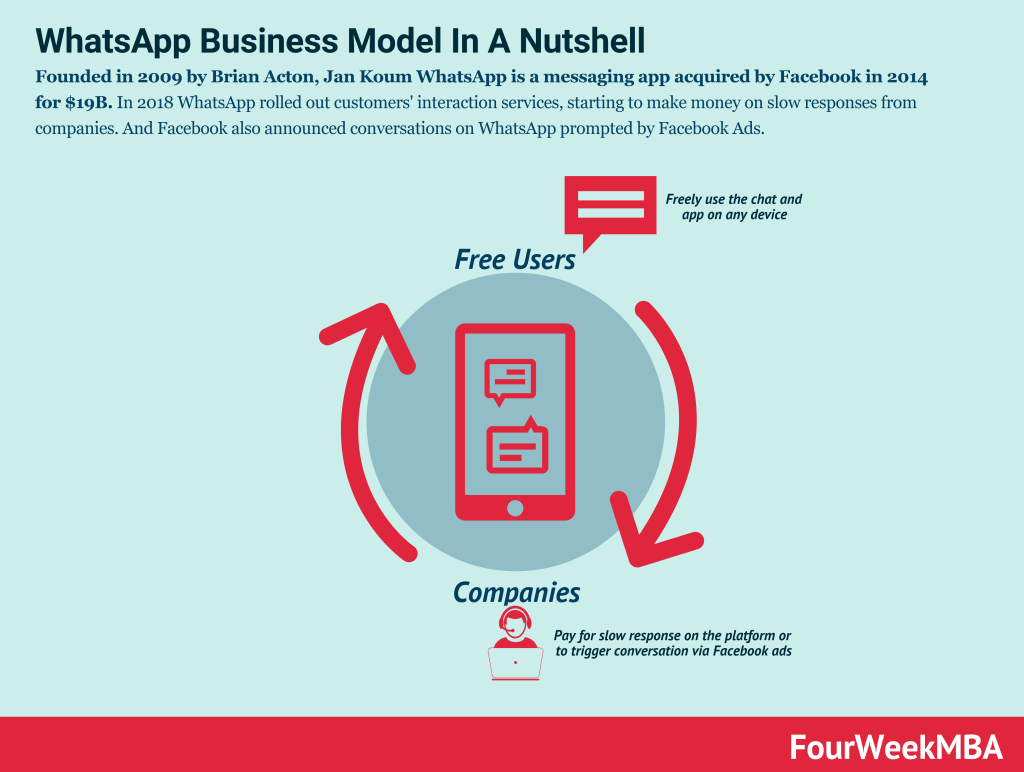
Founded in 2009 by Brian Acton, Jan Koum WhatsApp is a messaging app acquired by Facebook in 2014 for $19B. In 2018 WhatsApp rolled out customers’ interaction services, starting to make money on slow responses from companies. And Facebook also announced conversations on WhatsApp prompted by Facebook Ads.
Interactive Framework
Where Does This Company Sit in the AI Stack?
Nine players across four layers. Click each to explore positioning.
The AI landscape is a vertical integration stack. Every major player occupies different layers — and the layer you control determines your moat:
Distribution Layer — Who reaches the user
Google (Search+Android), Apple (2.2B devices), Meta (3.2B DAU), Microsoft (Office)
Distribution beats model quality. Models are converging; reach is diverging. The company that reaches the user captures the value regardless of whose model powers it.
The most strategically valuable layer. Whoever controls orchestration — skills, memory, tool access, trust boundaries — creates compound advantages that strengthen over time.
Model Layer — The reasoning engine
GPT, Claude, Gemini, Llama — converging and commoditizing
Open source (Llama) accelerates commoditization. A model moat only holds at the absolute frontier — and the frontier is temporary. Value migrates to layers above and below.
Infrastructure Layer — The physical substrate
NVIDIA, TSMC, Azure, AWS, GCP — the deepest moat
Physical assets: compute, power, chips. Takes decades and billions to build. Virtually impossible to replicate. The picks-and-shovels position — wins regardless of who wins the model race.
AI is fundamentally transforming Facebook’s advertising revenue model, which accounts for over 97% of the company’s income. The platform’s machine learning algorithms have revolutionized ad targeting by analyzing vast amounts of user data—including post interactions, page visits, demographic information, and behavioral patterns—to create incredibly precise audience segments. A concrete example is Facebook’s Lookalike Audiences feature, where AI identifies users who share similar characteristics with a business’s existing customers, dramatically improving ad conversion rates. When a local fitness studio uploads their customer email list, Facebook’s AI analyzes those users’ profiles and behaviors to find thousands of similar users who are likely interested in fitness services. This AI-driven precision targeting allows businesses to achieve higher return on ad spend while enabling Facebook to charge premium rates for these highly effective advertisements, creating a powerful revenue engine that grows more sophisticated with each user interaction.
Gennaro is the creator of FourWeekMBA, which reached about four million business people, comprising C-level executives, investors, analysts, product managers, and aspiring digital entrepreneurs in 2022 alone | He is also Director of Sales for a high-tech scaleup in the AI Industry | In 2012, Gennaro earned an International MBA with emphasis on Corporate Finance and Business Strategy.


![Facebook/Meta Business Model vs Amazon Business Model: Key Differences & When to Use Each [2026]](data:image/svg+xml,%3Csvg%20xmlns='http://www.w3.org/2000/svg'%20viewBox='0%200%20150%20150'%3E%3C/svg%3E "Facebook/Meta Business Model vs Amazon Business Model: Key Differences & When to Use Each [2026]")
![Facebook/Meta Business Model vs Amazon Business Model: Key Differences & When to Use Each [2026]](https://i0.wp.com/fourweekmba.com/wp-content/plugins/contextual-related-posts/default.png?resize=150%2C150&ssl=1 "Facebook/Meta Business Model vs Amazon Business Model: Key Differences & When to Use Each [2026]")

")


")
