
| KPI | Formula to Measure | When to Use | Advantages | Drawbacks |
|---|---|---|---|---|
| Employee Turnover Rate | (Number of Employees Who Left / Total Employees) * 100% | Measure employee retention and job satisfaction | Identifies HR and management issues | Ignores hiring and training costs |
| Employee Satisfaction Index | (Total Satisfied Employees / Total Surveyed Employees) * 100% | Assess overall employee morale and engagement | Helps improve workplace culture and retention | Subjective and dependent on survey quality |
| Time to Fill a Vacancy | (Total Days to Fill All Vacancies / Number of Vacancies Filled) | Evaluate recruitment efficiency and speed | Reduces downtime and cost of vacancies | Ignores variations in job complexity |
| Cost per Hire | (Total Recruitment Costs / Number of Hires) | Monitor recruitment expenses and efficiency | Identifies cost-effective hiring methods | Ignores quality of hires |
| Training Hours per Employee | (Total Training Hours / Total Number of Employees) | Assess employee development and skill enhancement | Helps improve workforce competence and productivity | Ignores training quality |
| Absenteeism Rate | (Total Days of Employee Absence / (Total Employee Workdays – Paid Time Off)) * 100% | Measure employee attendance and reliability | Identifies trends in absenteeism and its impact | Ignores legitimate absences |
| HR to Employee Ratio | (Total HR Staff / Total Employees) | Evaluate HR department size and workload | Helps optimize HR department staffing | Ignores HR department efficiency |
| Compensation Ratio | (Total Compensation Costs / Total Operating Costs) * 100% | Assess the proportion of expenses dedicated to employee compensation | Identifies cost control and competitiveness | Ignores non-compensation expenses |
| Benefits Cost per Employee | (Total Benefits Costs / Total Number of Employees) | Monitor employee benefits expenses | Helps control benefits-related expenditures | Ignores variations in benefits usage |
| Training Return on Investment (ROI) | [(Gain from Training – Cost of Training) / Cost of Training] * 100% | Evaluate the effectiveness of training programs | Measures the impact of training on performance | Ignores intangible benefits of training |
| Employee Engagement Score | (Total Engaged Employees / Total Surveyed Employees) * 100% | Assess employee commitment and enthusiasm | Identifies areas for improvement in engagement | Subjective and dependent on survey quality |
| Leadership Development ROI | [(Leadership Impact – Leadership Development Cost) / Leadership Development Cost] * 100% | Evaluate the effectiveness of leadership development programs | Measures the impact of leadership training | Ignores long-term leadership contributions |
| Diversity and Inclusion Index | (Total Diverse and Inclusive Employees / Total Employees) * 100% | Assess diversity and inclusion efforts | Helps create a more inclusive and equitable workplace | Subjective and dependent on self-reporting |
| Employee Churn Rate | (Number of Employees Who Left / Average Number of Employees) * 100% | Monitor employee turnover and instability | Identifies issues causing rapid workforce changes | Ignores temporary or seasonal fluctuations |
| Average Employee Tenure | (Total Years of Service for All Employees / Total Number of Employees) | Assess employee loyalty and retention | Helps create long-term workforce strategies | Ignores variations in job roles and levels |
| HR Technology Utilization | (Number of HR Technology Users / Total HR Staff) * 100% | Measure the adoption of HR technology solutions | Identifies technology efficiency and effectiveness | Ignores employee technology proficiency |
| Employee Health and Wellness Participation | (Number of Employees Participating / Total Employees) * 100% | Monitor employee participation in wellness programs | Promotes a healthy workplace culture | Ignores employee health outcomes |
| Exit Interview Participation Rate | (Number of Exit Interviews Conducted / Number of Employee Departures) * 100% | Evaluate employee feedback collection effectiveness | Identifies reasons for employee departures | Ignores feedback quality and honesty |
| HR Compliance Rate | (Number of Compliance Audits Passed / Total Compliance Audits Conducted) * 100% | Ensure HR department adherence to legal and regulatory standards | Avoids legal penalties and risks | Ignores underlying compliance issues |
| Employee Self-Service Adoption Rate | (Number of Employees Using Self-Service Tools / Total Employees) * 100% | Measure employee utilization of self-service HR tools | Increases HR efficiency and employee empowerment | Ignores non-adopters’ needs and preferences |
| Cost of Employee Disputes | Total Cost of Resolving Employee Disputes | Monitor the financial impact of employee disputes | Identifies areas for conflict resolution improvement | Ignores non-financial dispute aspects |
Read Next: OKR, SMART Goals.
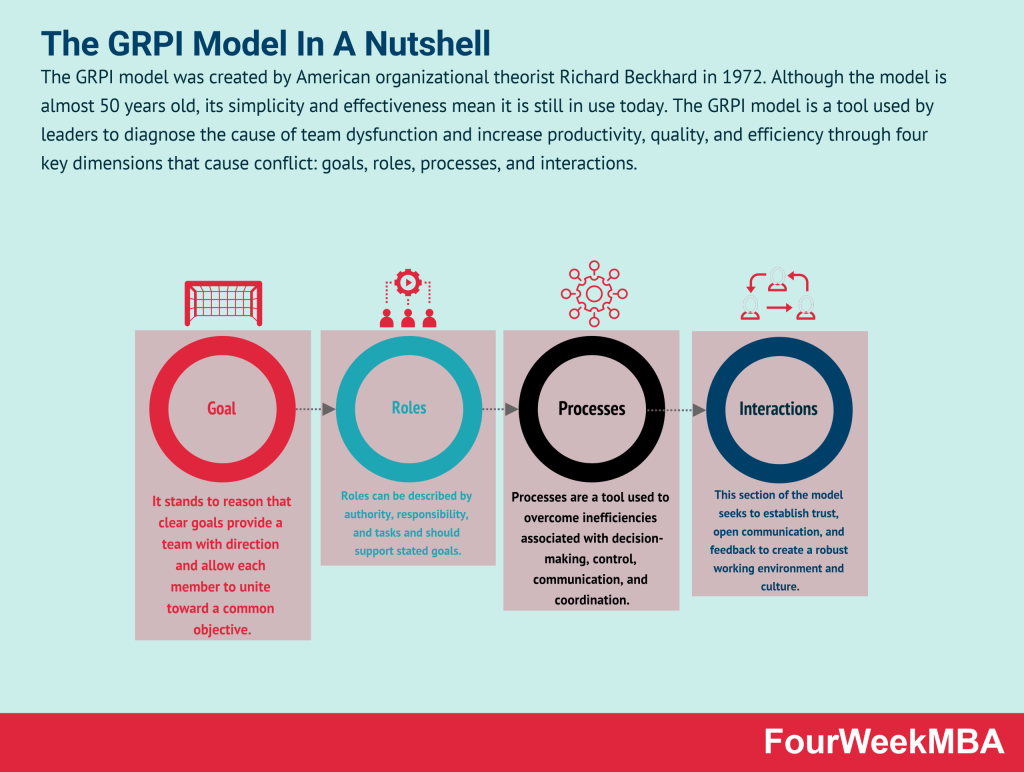
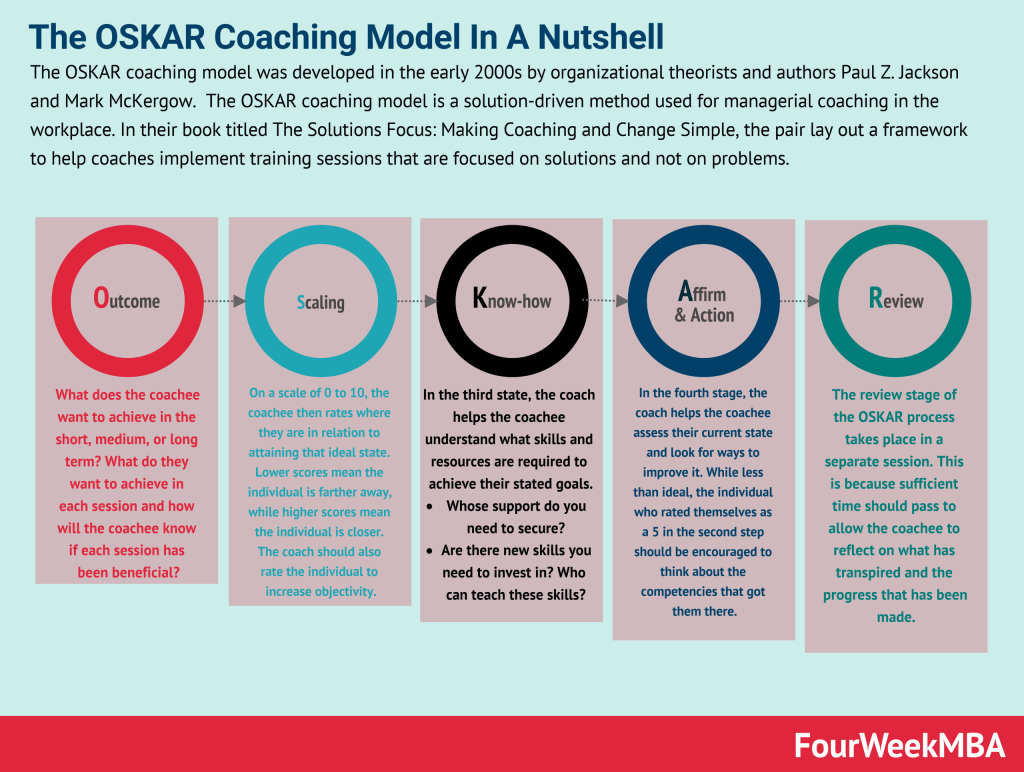
Connected Business Frameworks and Concepts


Read Next: SWOT Analysis, Personal SWOT Analysis, TOWS Matrix, PESTEL Analysis, Porter’s Five Forces, TOWS Matrix, SOAR Analysis.
Read Next: Biases, Bounded Rationality, Mandela Effect, Dunning-Kruger Effect, Lindy Effect, Crowding Out Effect, Bandwagon Effect.
Main Free Guides:
