The L-shaped recovery refers to an economy that declines steeply and then flatlines with weak or no growth. On a graph plotting GDP against time, this precipitous fall combined with a long period of stagnation looks like the letter “L”. The L-shaped recovery is sometimes called an L-shaped recession because the economy does not return to trend line growth. The L-shaped recovery, therefore, is a recession shape used by economists to describe different types of recessions and their subsequent recoveries. In an L-shaped recovery, the economy is characterized by a severe recession with high unemployment and near-zero economic growth.
Aspect
Explanation
Definition
An L-shaped recovery is an economic scenario in which a significant economic downturn, often marked by a sharp decline in economic activity, is followed by a slow and prolonged period of recovery characterized by stagnant or very slow growth. In this scenario, the economy does not experience a quick bounce back to pre-recession levels, as seen in V-shaped recoveries, but rather follows a flat or “L” shaped trajectory, indicating a prolonged period of economic weakness. L-shaped recoveries are typically the result of deep and systemic economic challenges, such as financial crises or structural economic imbalances.
Key Concepts
– Economic Downturn: An initial period of severe economic decline, often caused by external shocks or internal imbalances. – Slow Recovery: The distinguishing feature is the slow pace of recovery that follows the downturn. – Persistent Weakness: The economy remains below its potential for an extended period, with limited growth. – Structural Issues: L-shaped recoveries are often associated with underlying structural problems in the economy. – Lack of Quick Rebound: Unlike V-shaped recoveries, there is no rapid rebound to pre-recession levels of economic activity.
Characteristics
– Long Duration: L-shaped recoveries are characterized by a prolonged period of economic weakness that can last for years. – High Unemployment: Unemployment rates may remain elevated for an extended period. – Weak Consumer and Business Confidence: Confidence in the economy may be low, leading to reduced consumer spending and business investment. – Limited Credit Availability: Banks may be cautious about lending, limiting access to credit for businesses and individuals. – Policy Intervention: Governments and central banks often implement stimulus measures to try to hasten the recovery.
Implications
– Job Market Challenges: Persistent high unemployment or underemployment can have significant social and economic consequences. – Income Inequality: Economic weakness can exacerbate income inequality as the most vulnerable segments of the population are often hit hardest. – Budgetary Pressures: Governments may face challenges in maintaining public services and managing budget deficits. – Reduced Investment: Businesses may postpone capital investments, impacting long-term economic growth. – Public Policy Response: Policymakers may need to implement targeted policies to address the underlying causes of the prolonged downturn.
Advantages
L-shaped recoveries are generally not considered advantageous, as they represent a challenging economic scenario with limited growth opportunities. However, some potential benefits may include a more cautious approach to economic policies and a focus on addressing structural weaknesses in the economy for long-term sustainability.
Drawbacks
– Protracted Economic Weakness: The most significant drawback is the extended period of economic stagnation, which can result in widespread economic hardship. – High Unemployment: Elevated unemployment rates can lead to social and political instability. – Policy Challenges: Policymakers face the challenge of implementing effective measures to jumpstart the economy. – Uncertainty: Prolonged economic weakness can create uncertainty for businesses and investors. – Budget Deficits: Government budget deficits may increase as a result of reduced tax revenue and increased social support spending.
Applications
L-shaped recoveries are a concept used by economists, policymakers, and financial analysts to assess and predict economic trends and challenges. It informs discussions around economic policy, including the need for stimulus measures and structural reforms. Additionally, businesses and investors closely monitor economic conditions to adapt their strategies to the prevailing economic environment during an L-shaped recovery.
Use Cases
– Great Recession (2007-2009): The global financial crisis led to an L-shaped recovery in many economies, characterized by a long period of slow growth and high unemployment. – Japan’s Lost Decades: Japan experienced a prolonged L-shaped recovery following its asset price bubble burst in the early 1990s. The economy struggled with deflation and stagnant growth. – Eurozone Debt Crisis: Several European countries, including Greece and Spain, faced L-shaped recoveries after the Eurozone debt crisis, with slow growth and austerity measures impacting their economies. – COVID-19 Pandemic: The pandemic-induced economic downturn in 2020 led to concerns about the potential for an L-shaped recovery due to the virus’s ongoing impact, but recovery patterns have varied by region and sector. – Oil Price Crash (1980s): The collapse of oil prices in the 1980s led to an L-shaped recovery in oil-dependent economies, such as those in the Middle East.
The most important characteristic of an L-shaped recovery is a failure for the economy to revert to full employment after a recession.
Controlling forces such as the government do not allocate enough resources to mobilize workers and increase business output, which means more workers are unemployed for longer and some may choose to leave the workforce entirely.
By extension, factories, equipment, and other capital assets may sit idle or at the very least underutilized.
The L-shaped recovery is considered to be the most severe form of recovery and is sometimes called a depression.
The affected economy may take years or even decades to recover.
Examples of L-shaped recoveries
Here are some real-world examples of L-shaped recoveries:
The Japanese asset price bubble resulted in greatly inflated real estate and stock market prices between 1986 and 1991. During the late 1980s, the Japanese economy was booming as a result of exuberance in equity markets and skyrocketing real estate prices.
The Nikkei stock market index reached a peak of 38,916 on December 29, 1989. The bubble burst soon after as the Bank of Japan raised bank lending rates to try to keep inflation and speculation in check. The economy lost over $2 trillion in value over the next twelve months.
The Japanese asset price bubble was primarily caused by bank deregulation and expansionary monetary policy. Japanese banks who had lost their corporate clients instead lent to riskier small and medium enterprises. The 1985 Plaza Accord trade agreement also caused a sharp appreciation in the yen, which caused massive speculation that the Bank of Japan was happy to ride for years.
Japan’s economy grew at unprecedented levels between the end of the Second World War and the late 1980s.
After the asset-price bubble burst in 1992, deflation followed and the country experienced a long period of slow growth now known as The Lost Decades.
The Japanese economy has not yet returned to the growth rates it enjoyed before the crash.
The Stock Market Crash of 1929 was a major American stock market crash in October 1929 that precipitated the beginning of the Great Depression.
Black Friday, Black Monday, and Black Tuesday are terms used to describe the calamitous fall of the Dow Jones Industrial Average over three days. The index would slide further in the following years and would not recapture its pre-crash value until November 1954.
The Stock Market Crash of 1929 was caused by complacency during the economic prosperity of the 1920s with many new investors buying stocks on margin. Government mismanagement and company share prices that did not reflect their true value were also contributing factors.
Unemployment was as high as 25% after the stock market crash of 1929 in the United States.
GDP contracted significantly and high unemployment persisted for over a decade, despite attempts by President Hoover to increase taxes and introduce federal funding for unemployment benefits.
The global financial crisis (GFC) refers to a period of extreme stress in global financial markets and banking systems between 2007 and 2009.
The global financial crisis was precipitated by changes to legislation in the 1970s. The changes created the subprime mortgage industry and forced banks to loosen their lending criteria for lower-income borrowers.
When the subprime market collapsed in 2008, one-fifth of homes in the United States had been purchased with subprime loans. Bear Stearns and Lehman Brothers collapsed because of their excessive exposure to toxic debt, while consumers were left with mortgages far exceeding the value of their homes. In the aftermath of the GFC, interest rates were reduced to near zero and there was sweeping financial reform.
The Bush and Obama administrations instituted a wave of expansionary monetary policy underpinned by new lending facilities and multiple rounds of quantitative easing, but unemployment remained above 5% until 2016.
GDP growth was just 2.3% over the same period with the economy experiencing the slowest recovery since the Great Depression decades earlier.
What causes an L-shaped recovery?
To some extent, the causes of an L-shaped recovery are particular to the shock or crash that preceded it. The recovery seen after the Great Recession, for example, was caused by:
The inability of the housing sector to rebound after so many loan foreclosures.
The lack of financial support from the government, particularly in the immediate aftermath of the market collapse, and
The dire lack of available credit for consumers and businesses as banks diverted capital to repaying the large amount of debt they had amassed.
Having said that, the key determinant in whether an L-shaped recovery occurs is the shock’s ability to damage the supply side of an economy – otherwise known as capital formation.
When the lending ability of a bank is diminished and the value of public and private assets does not grow, recovery is hindered and employee skills are lost as individuals exit the workforce. Productivity then decreases and the shock becomes structural.
Key takeaways
The L-shaped recovery is a recession shape used by economists to describe different types of recessions and their subsequent recoveries. In an L-shaped recovery, the economy is characterized by a severe recession with high unemployment and near-zero economic growth.
Real-world examples of an L-shaped recovery include the Japanese asset price bubble, the Great Depression, and the Great Recession.
To some extent, the factors responsible for an L-shaped recovery are unique to the shock or crash that preceded it. However, whether such a recovery occurs depends on the shock’s ability to damage the supply side of an economy and its structure.
Key Highlights
Definition and Characteristics:
An L-shaped recovery describes an economic scenario where the economy experiences a sharp decline followed by a prolonged period of stagnation with weak or no growth.
On a graph of GDP against time, the shape resembles the letter “L,” indicating a failure to return to trend line growth.
This type of recovery is marked by a severe recession, high unemployment, and limited economic growth.
Causes and Implications:
An L-shaped recovery occurs when the economy fails to return to full employment after a recession.
Government and other controlling forces may not allocate enough resources to stimulate economic activity, leading to prolonged high unemployment.
The economy’s capital assets, including factories and equipment, might remain underutilized or idle.
An L-shaped recovery is considered one of the most severe forms and is sometimes referred to as a depression.
The recovery period can extend over years or even decades.
Examples of L-Shaped Recoveries:
The Japanese Asset Price Bubble: In the late 1980s, Japan experienced an asset price bubble followed by a severe recession. The economy faced prolonged slow growth known as “The Lost Decades.”
The Great Depression: The Stock Market Crash of 1929 led to a prolonged economic downturn characterized by high unemployment and contraction in GDP.
The Great Recession: The global financial crisis of 2007-2009 resulted in a slow recovery marked by persistently high unemployment and sluggish GDP growth.
Causes of L-Shaped Recovery:
Causes of an L-shaped recovery are specific to the shock or crash that preceded it.
In the case of the Great Recession, factors included the housing sector’s inability to rebound, lack of immediate government support post-market collapse, and limited available credit.
Supply-Side Impact:
The extent to which the supply side of an economy, including capital formation, is damaged by the shock determines the occurrence of an L-shaped recovery.
Diminished bank lending ability, stagnant asset values, and reduced productivity can hinder recovery and lead to structural economic challenges.
Key Takeaways:
An L-shaped recovery depicts a severe recession followed by a prolonged period of stagnant or weak economic growth.
It is characterized by high unemployment and failure to return to trend line growth.
Real-world examples include the Japanese asset price bubble, the Great Depression, and the Great Recession.
The ability of a shock to damage the supply side of the economy and its structure is a key determinant in the occurrence of an L-shaped recovery.
Tulip mania was a period during the 17th century where contract prices for tulip bulbs reached extremely high levels before crashing in 1637.
The causes of tulip mania have perhaps been distorted over the centuries, with many assuming it was one of the first examples of a market bubble bursting. However, the proliferation of once rare tulip bulbs probably lead to them becoming less desirable.
Tulip mania remains a popular term to describe markets where high prices are associated with low value or low utility items, including baseball cards, Beanie Babies, and NFTs.
The Mississippi bubble occurred when a fraudulent fiat banking system was unleashed in a French economy on the verge of bankruptcy.
Scottish banker John Law proposed that the French transition from gold and silver-based currency to paper currency. Law theorized that he could sell shares in the Mississippi Company to pay off French national debt. When the company secured total control of European trade and tax collection, investor speculation increased to unsustainable levels.
The company share price reached its peak in January 1720 as more and more speculative investors entered the fray. Law continued to issue banknotes to fund share purchases, which inevitably caused hyperinflation. Less than twelve months later, shares in the Mississippi Company declined by 1900% and Law had to flee France in disgrace.
The South Sea Bubble describes the financial collapse of the South Sea Company in 1720, which was formed to supply slaves to Spanish America and reduce Britain’s national debt.
Investors saw the potential for the South Sea Company to collect interest on the loan in addition to collecting profits from its gold, silver, and slave interests. Positive sentiment was also driven by the actions of the government.
Lucrative trade profits never materialized, which caused the share price to become dangerously overvalued. Instead, the South Sea Company operated more like a bank and less like a shipping business. Capital invested from waves of new investors was redistributed to older investors in an early Ponzi scheme. The share price crashed in December 1720, with many South Sea Company directors impeached or imprisoned.
The dot-com bubble describes a rapid rise in technology stock equity valuations during the bull market of the late 1990s. The stock market bubble was caused by rampant speculation of internet-related companies.
At the height of the dot-com bubble, instances of private investors quitting their day jobs to trade on the financial market were common. Thousands of companies held profitable IPOs despite earning no profit or even revenue in some cases.
The dot-com bubble began to burst after interest rates were raised five times between 1999 and 2000. Wall Street analysts, perhaps seeing the writing on the wall, advised investors to lower their exposure to dot-com stocks. The NASDAQ peaked in March 2000 and had lost 80% of its value by October 2002.
The idea of a market economy first came from classical economists, including David Ricardo, Jean-Baptiste Say, and Adam Smith. All three of these economists were advocates for a free market. They argued that the “invisible hand” of market incentives and profit motives were more efficient in guiding economic decisions to prosperity than strict government planning.
Positive economics is concerned with describing and explaining economic phenomena; it is based on facts and empirical evidence. Normative economics, on the other hand, is concerned with making judgments about what “should be” done. It contains value judgments and recommendations about how the economy should be.
When there is an increased price of goods and services over a long period, it is called inflation. In these times, currency shows less potential to buy products and services. Thus, general prices of goods and services increase. Consequently, decreases in the purchasing power of currency is called inflation.
Asymmetric information as a concept has probably existed for thousands of years, but it became mainstream in 2001 after Michael Spence, George Akerlof, and Joseph Stiglitz won the Nobel Prize in Economics for their work on information asymmetry in capital markets. Asymmetric information, otherwise known as information asymmetry, occurs when one party in a business transaction has access to more information than the other party.
Autarky comes from the Greek words autos (self)and arkein (to suffice) and in essence, describes a general state of self-sufficiency. However, the term is most commonly used to describe the economic system of a nation that can operate without support from the economic systems of other nations. Autarky, therefore, is an economic system characterized by self-sufficiency and limited trade with international partners.
Creative destruction was first described by Austrian economist Joseph Schumpeter in 1942, who suggested that capital was never stationary and constantly evolving. To describe this process, Schumpeter defined creative destruction as the “process of industrial mutation that incessantly revolutionizes the economic structure from within, incessantly destroying the old one, incessantly creating a new one.” Therefore, creative destruction is the replacing of long-standing practices or procedures with more innovative, disruptive practices in capitalist markets.
Happiness economics seeks to relate economic decisions to wider measures of individual welfare than traditional measures which focus on income and wealth. Happiness economics, therefore, is the formal study of the relationship between individual satisfaction, employment, and wealth.
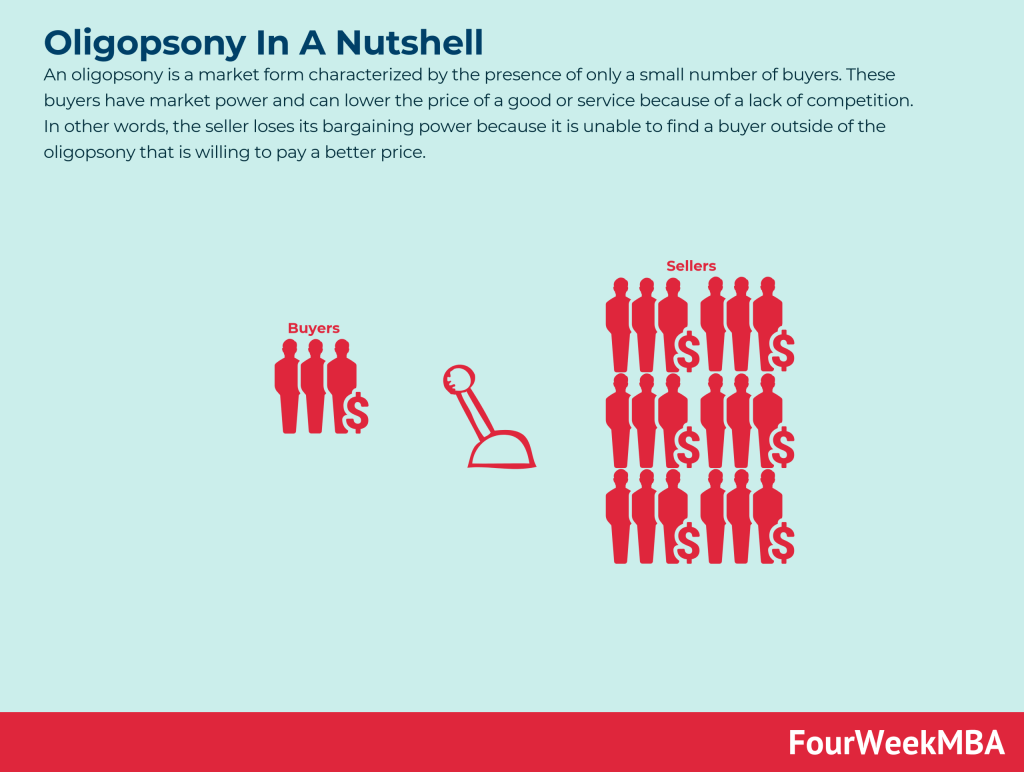
An oligopsony is a market form characterized by the presence of only a small number of buyers. These buyers have market power and can lower the price of a good or service because of a lack of competition. In other words, the seller loses its bargaining power because it is unable to find a buyer outside of the oligopsony that is willing to pay a better price.
The term “animal spirits” is derived from the Latin spiritus animalis, loosely translated as “the breath that awakens the human mind”. As far back as 300 B.C., animal spirits were used to explain psychological phenomena such as hysterias and manias. Animal spirits also appeared in literature where they exemplified qualities such as exuberance, gaiety, and courage. Thus, the term “animal spirits” is used to describe how people arrive at financial decisions during periods of economic stress or uncertainty.
State capitalism is an economic system where business and commercial activity is controlled by the state through state-owned enterprises. In a state capitalist environment, the government is the principal actor. It takes an active role in the formation, regulation, and subsidization of businesses to divert capital to state-appointed bureaucrats. In effect, the government uses capital to further its political ambitions or strengthen its leverage on the international stage.
The boom and bust cycle describes the alternating periods of economic growth and decline common in many capitalist economies. The boom and bust cycle is a phrase used to describe the fluctuations in an economy in which there is persistent expansion and contraction. Expansion is associated with prosperity, while the contraction is associated with either a recession or a depression.
The paradox of thrift was popularised by British economist John Maynard Keynes and is a central component of Keynesian economics. Proponents of Keynesian economics believe the proper response to a recession is more spending, more risk-taking, and less saving. They also believe that spending, otherwise known as consumption, drives economic growth. The paradox of thrift, therefore, is an economic theory arguing that personal savings are a net drag on the economy during a recession.
In simplistic terms, the circular flow model describes the mutually beneficial exchange of money between the two most vital parts of an economy: households, firms and how money moves between them. The circular flow model describes money as it moves through various aspects of society in a cyclical process.
Trade deficits occur when a country’s imports outweigh its exports over a specific period. Experts also refer to this as a negative balance of trade. Most of the time, trade balances are calculated based on a variety of different categories.
A market type is a way a given group of consumers and producers interact, based on the context determined by the readiness of consumers to understand the product, the complexity of the product; how big is the existing market and how much it can potentially expand in the future.
Rational choice theory states that an individual uses rational calculations to make rational choices that are most in line with their personal preferences. Rational choice theory refers to a set of guidelines that explain economic and social behavior. The theory has two underlying assumptions, which are completeness (individuals have access to a set of alternatives among they can equally choose) and transitivity.
The peer-to-peer (P2P) economy is one where buyers and sellers interact directly without the need for an intermediary third party or other business. The peer-to-peer economy is a business model where two individuals buy and sell products and services directly. In a peer-to-peer company, the seller has the ability to create the product or offer the service themselves.
The term “knowledge economy” was first coined in the 1960s by Peter Drucker. The management consultant used the term to describe a shift from traditional economies, where there was a reliance on unskilled labor and primary production, to economies reliant on service industries and jobs requiring more thinking and data analysis. The knowledge economy is a system of consumption and production based on knowledge-intensive activities that contribute to scientific and technical innovation.
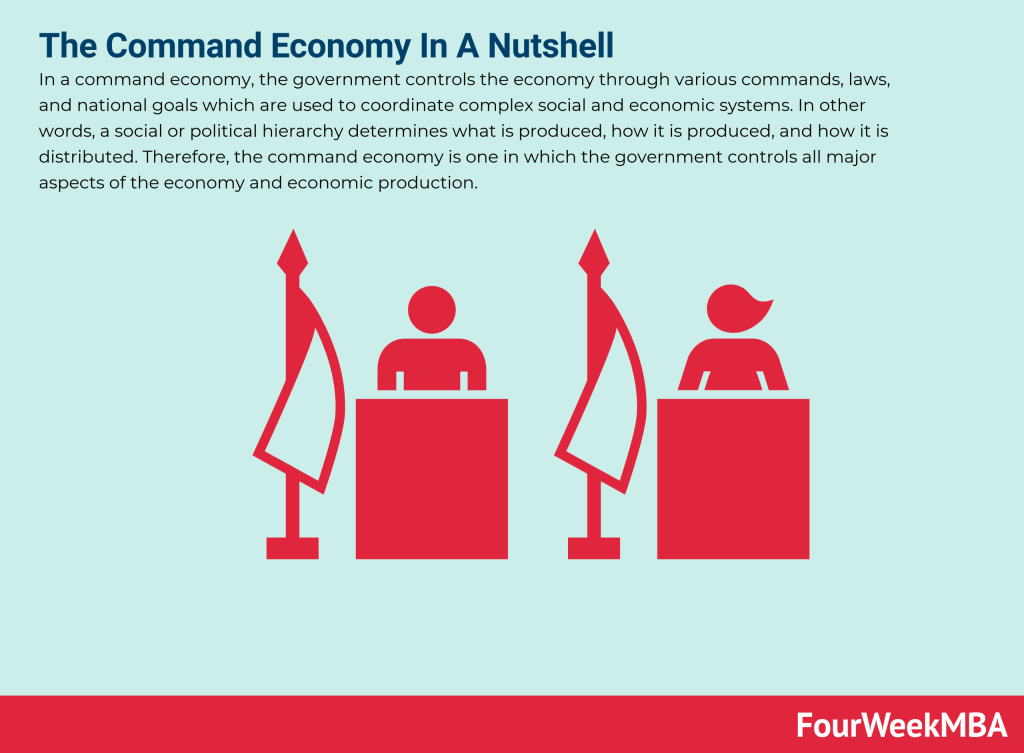
In a command economy, the government controls the economy through various commands, laws, and national goals which are used to coordinate complex social and economic systems. In other words, a social or political hierarchy determines what is produced, how it is produced, and how it is distributed. Therefore, the command economy is one in which the government controls all major aspects of the economy and economic production.
How do you protect your rights as a worker? Who is there to help defend you against unfair and unjust work conditions? Both of these questions have an answer, and it’s a solution that many are familiar with. The answer is a labor union. From construction to teaching, there are labor unions out there for just about any field of work.
The bottom of the pyramid is a term describing the largest and poorest global socio-economic group. Franklin D. Roosevelt first used the bottom of the pyramid (BOP) in a 1932 public address during the Great Depression. Roosevelt noted that – when talking about the ‘forgotten man:’ “these unhappy times call for the building of plans that rest upon the forgotten, the unorganized but the indispensable units of economic power.. that build from the bottom up and not from the top down, that put their faith once more in the forgotten man at the bottom of the economic pyramid.”
Glocalization is a portmanteau of the words “globalization” and “localization.” It is a concept that describes a globally developed and distributed product or service that is also adjusted to be suitable for sale in the local market. With the rise of the digital economy, brands now can go global by building a local footprint.
Market fragmentation is most commonly seen in growing markets, which fragment and break away from the parent market to become self-sustaining markets with different products and services. Market fragmentation is a concept suggesting that all markets are diverse and fragment into distinct customer groups over time.
The L-shaped recovery refers to an economy that declines steeply and then flatlines with weak or no growth. On a graph plotting GDP against time, this precipitous fall combined with a long period of stagnation looks like the letter “L”. The L-shaped recovery is sometimes called an L-shaped recession because the economy does not return to trend line growth. The L-shaped recovery, therefore, is a recession shape used by economists to describe different types of recessions and their subsequent recoveries. In an L-shaped recovery, the economy is characterized by a severe recession with high unemployment and near-zero economic growth.
Comparative advantage was first described by political economist David Ricardo in his book Principles of Political Economy and Taxation. Ricardo used his theory to argue against Great Britain’s protectionist laws which restricted the import of wheat from 1815 to 1846. Comparative advantage occurs when a country can produce a good or service for a lower opportunity cost than another country.
The Easterlin paradox was first described by then professor of economics at the University of Pennsylvania Richard Easterlin. In the 1970s, Easterlin found that despite the American economy experiencing growth over the previous few decades, the average level of happiness seen in American citizens remained the same. He called this the Easterlin paradox, where income and happiness correlate with each other until a certain point is reached after at least ten years or so. After this point, income and happiness levels are not significantly related. The Easterlin paradox states that happiness is positively correlated with income, but only to a certain extent.
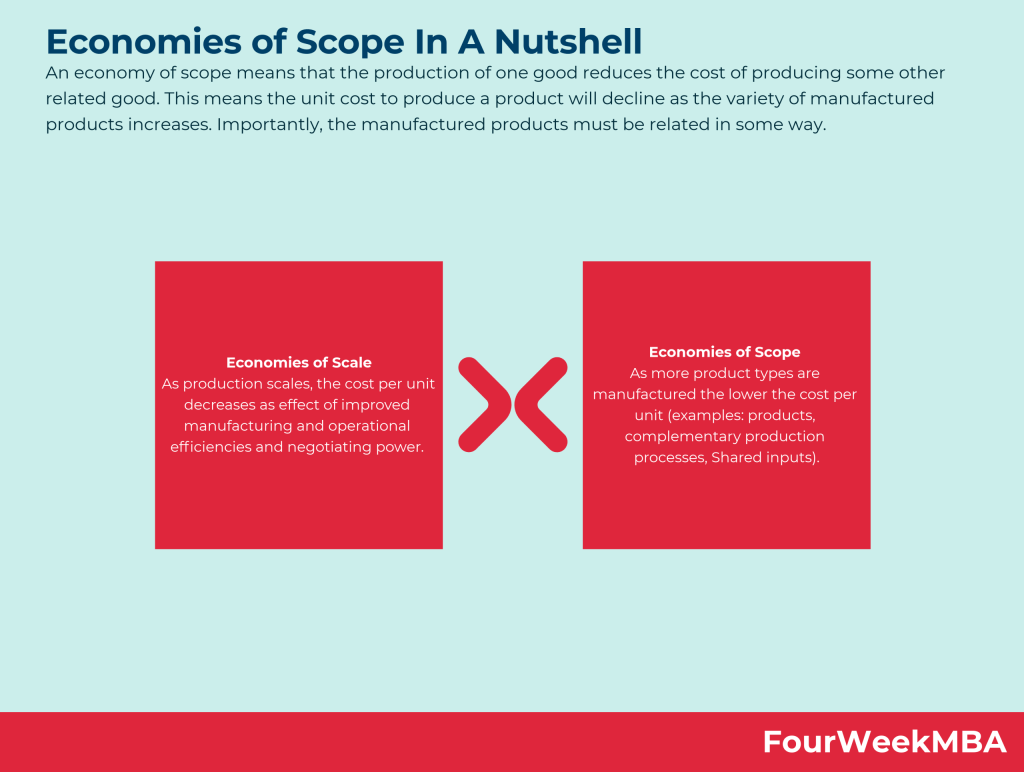
In Economics, Economies of Scale is a theory for which, as companies grow, they gain cost advantages. More precisely, companies manage to benefit from these cost advantages as they grow, due to increased efficiency in production. Thus, as companies scale and increase production, a subsequent decrease in the costs associated with it will help the organizationscale further.
In Economics, a Diseconomy of Scale happens when a company has grown so large that its costs per unit will start to increase. Thus, losing the benefits of scale. That can happen due to several factors arising as a company scales. From coordination issues to management inefficiencies and lack of proper communication flows.
An economy of scope means that the production of one good reduces the cost of producing some other related good. This means the unit cost to produce a product will decline as the variety of manufactured products increases. Importantly, the manufactured products must be related in some way.
Price sensitivity can be explained using the price elasticity of demand, a concept in economics that measures the variation in product demand as the price of the product itself varies. In consumer behavior, price sensitivity describes and measures fluctuations in product demand as the price of that product changes.
Gennaro is the creator of FourWeekMBA, which reached about four million business people, comprising C-level executives, investors, analysts, product managers, and aspiring digital entrepreneurs in 2022 alone | He is also Director of Sales for a high-tech scaleup in the AI Industry | In 2012, Gennaro earned an International MBA with emphasis on Corporate Finance and Business Strategy.