Most of Spotify’s costs are payments for content. In 2025 (year to 31 December 2025) cost of revenue, which consists mainly of royalty and distribution costs paid to record labels, music publishers, audiobook publishers and other rights holders, was €11.7 billion out of €17.2 billion of revenue, about 68% (calculated). Research and development, sales and marketing, and general and administrative costs took another €3.3 billion, leaving €2.2 billion of operating income, according to Spotify’s Form 20-F.
Cost of revenue was €11.69 billion in 2025. Subscription music royalties are generally the greater of a percentage of relevant revenue and a per-user amount; ad-supported royalties are typically a percentage of revenue, and audiobook royalties are generally consumption-based.
02
Research and development
R&D cost €1.39 billion in 2025, 8% of revenue, down from 13% in 2023. Spotify said the 2025 fall was due mainly to lower social costs linked to share price movements.
Sales and marketing cost €1.43 billion in 2025, also 8% of revenue, against 12% in 2023.
04
General and administrative
G&A was €479 million in 2025, 3% of revenue. Together the three operating lines fell from €3.84 billion in 2023 to €3.30 billion in 2025 while revenue grew.
What changed in 2025-26
Premium carries the margin
In 2025 the Premium segment earned a 34% gross margin and the Ad-Supported segment 18%, up from 29% and 4% in 2023. Spotify credits Ad-Supported’s rise mainly to lower podcast costs.
From loss to profit
Operating income was €2.20 billion in 2025, against €1.37 billion in 2024 and an operating loss of €446 million in 2023. Net income was €2.21 billion in 2025.
Q3 2026: costs rise again, from a higher base
In the quarter to 30 September 2026 revenue was €4.97 billion, up 16%, and gross margin a third-quarter record of 33.0%. Operating expenses rose to €967 million from €769 million, which Spotify attributes to temporarily elevated marketing and cloud/AI spend.
AI features and cloud bills
Spotify runs on Google Cloud Platform and uses AI for features such as AI DJ and AI Playlist; in Q3 2026 it also launched an integration that lets listeners use Spotify through an AI agent. Its 20-F warns there is no assurance AI will make the business more efficient or profitable.
Operators: when your main cost scales with revenue, as royalties do, margin comes from pricing, mix and fixed-cost discipline rather than from volume alone.
Track gross margin by segment: Spotify's ad tier went from a 4% to an 18% gross margin in two years by cutting podcast costs.
Watch operating costs as a share of revenue: Spotify's fell from 29% in 2023 to 19% in 2025 (calculated).
Builders: count cloud and AI inference as a cost of the product; Spotify named cloud/AI spend as a driver of higher expenses in Q3 2026.
Investors: read 'social charges' separately; they move with Spotify's share price and swing reported R&D and G&A.
The Business Engineer lens
Spotify rents most of its catalogue, so its cost structure is set by rights holders and its profit by everything else. AI gives it a way to add value on top of licensed content, but it adds a new cost line in cloud and compute that has to earn its place.
Cost of revenue, mainly royalties and distribution costs paid to rights holders: €11.7 billion in 2025, about 68% of €17.2 billion of revenue (calculated).
How much does Spotify spend on R&D?
€1.39 billion in 2025, 8% of revenue, down from €1.73 billion (13%) in 2023.
Is Spotify profitable now?
Yes. It reported operating income of €2.20 billion and net income of €2.21 billion in 2025, after an operating loss of €446 million in 2023.
Why is the ad-supported tier less profitable?
Its gross margin was 18% in 2025 against 34% for Premium; Spotify says the ad tier's margin rose mainly because podcast costs fell.
The complete explainer, cleaned up and reformatted for mobile.
In short
Of Spotify’s €17.2B of 2025 revenue, cost of revenue, mostly payments to rights holders, took €11.7B (68%), leaving €5.5B of gross profit. Research, marketing and administration took €3.3B, leaving €2.2B of operating income (all calculated from the 20-F).
How we source: figures on this page come from the company’s own filings (SEC 10-K, 10-Q and earnings releases, or its annual report), with the period stated next to each number. Last refreshed October 2026. Our methodology.
Spotify’s cost structure, 2016–2025
Spotify’s costs: €68 of every €100 goes to content. Source: Spotify Form 20-F, 2025 (year to 31 Dec 2025), SEC EDGAR: statement of operations (cost of revenue, R&D, sales and marketing, G&A), cost of revenue description, segment gross profit; 2023–2024 from the same filing. Shares calculated and rounded. Areas and bars to scale. Analysis by The Business Engineer.Drawing by The Business Engineer.
Year
Revenue
Cost of revenue*
Gross margin*
2025
€17.2B
€11.7B
32%
2024
€15.7B
€10.9B
30%
2023
€13.2B
€9.8B
26%
2022
€11.7B
€8.8B
25%
2021
€9.7B
€7.1B
27%
2020
€7.9B
€5.9B
26%
2019
€6.8B
€5.0B
25%
2018
€5.3B
€3.9B
26%
2017
€4.1B
€3.2B
21%
2016
€3.0B
€2.6B
14%
Source: Spotify annual reports on Form 20-F (latest 20-F). *Calculated.
What drives Spotify’s costs
Royalties scale with revenue. Cost of revenue rose to €11.7B in 2025, but more slowly than revenue, lifting gross margin to 32%.
Operating costs fell as a share. Operating expenses were 19% of revenue in 2025 vs 29% in 2023 (calculated).
What to watch
Q2 2026: revenue €4.8B (+14%), operating income €655M, 777M MAUs and 300M subscribers (Q2 2026 Form 6-K).
Ads: ad-supported MAUs +14% but ad revenue +1% in Q2 2026.
Earlier analysis and background (pre-2026 figures)
The text below is the earlier version of this page. Its figures refer to earlier periods and some were corrected above; the current, sourced figures are in the sections above.
Cost Structure
Spotify Cost Structure Breakdown
Where Spotify’s money goes — royalties, R&D, and operations
Key Elements
Content & Royalty Costs
Payments to music labels, publishers, and podcast creators totaling ~€11.7B in 2025 (~68% of revenue), the dominant cost driver.
Research & Development
Engineering, product development, and platform innovation costs of ~€1.4B in 2025, covering algorithms, features, and infrastructure.
Sales & Marketing
Advertising, promotions, partnerships, and subscriber acquisition spending as part of €1.9B in combined SG&A expenses.
General & Administrative
Corporate overhead including legal, finance, HR, and facilities costs, grouped with sales & marketing in Spotify’s €1.9B SG&A line.
Infrastructure & Hosting
Cloud computing costs (primarily Google Cloud Platform) for streaming delivery, data storage, and real-time personalization at scale.
Content Acquisition & Originals
Investments in Spotify-exclusive podcasts, audiobooks licensing, and original content programming to differentiate the platform.
Spotify generated €11.56 billion from premium members and €1.68 billion from ad-supported members. The premium membership revenue cost was €8.23 billion and €1.62B billion for the ad-supported segment. Thus, premium members generated a profit of €3.33B billion for Spotify in 2023. Meanwhile, the ad-supported segment generated a €62 million gross profit in 2023. The ad-supported segment, which is run almost at a loss, is critical for Spotify as it enables it to build a sustainable self-serving funnel to convert free users into paid subscribers!
Spotify is a two-sided marketplace, running a free ad-supported service and a paid membership. Founded in 2008 with the belief that music should be universally accessible, it generated €13.25 billion in 2023. Of these revenues, 87.3%, or €11.56 billion, came from premium memberships, while over 12.6%, or €1.68 billion, came from ad-supported members. By 2023, Spotify had over 600 million users, of which 236 million were premium members and 379 million weread-supported users.
While ad-supported users can still access the platform for free, they have limited access, as content is interrupted by ads, and not all content is available.
Premium and ad-supported have different cost structures. The premium model has higher gross margins compared to the ad-supported model.
For instance, in 2022, the premium revenue model had a gross margin of over 28%, whereas the ad-supported version had a gross margin of 2%.
Thus, if we look at it from a gross margin standpoint, the ad-supported version seems less interesting.
However, it’s key to remember that the ad-supported version represents the company’s acquisition funnel.
Free, ad-supported users, in many cases, turn into premium members.
In addition, Spotify has strengthened its advertising network. Thus we might expect the ad-supported version to scale much more quickly both in terms of revenues and gross margins in the coming decade!
From that perspective, Spotify’s ad-supported revenue stream is both a funnel and a flywheel.
It’s a funnel because it enables Spotify to identify the various steps in the users’ journey to have them become subscribers.
In this way, at each step of the way Spotify can identify the key steps to take to make sure that the users convert into premium members.
interaction with a brand until they become a paid customer and beyond.
Funnel marketing is modeled after the marketing funnel, a concept that tells the company how it should market to consumers based on their position in the funnel itself. The notion of a customer embarking on a journey when interacting with a brand was first proposed by Elias St. Elmo Lewis in 1898.
Funnel marketing typically considers three stages of a non-linear marketing funnel. These are top of the funnel (TOFU), middle of the funnel (MOFU), and bottom of the funnel (BOFU). Particular marketing strategies at each stage are adapted to the level of familiarity the consumer has with a brand.
On the other hand, Spotify’s ad-supported business is also a flywheel, as more users who join the platform will share and invite others to join for free.
Thus, spinning Spotify’s flywheel.
Flywheel marketing was first introduced in 2001 by Good to Great author Jim Collins, who likened the strategy to a flywheel. For those unaware, a flywheel is a mechanical device designed to store rotational energy in an efficient way. It can be difficult to spin at first, but once momentum is built, the flywheel can perpetuate its own motion and spin by itself. Flywheel marketing has become a critical component of growth for platform business models.
Thus, with the combination of Spotify’s funnel and its flywheel, an incredible digital company was built!
The sales funnel is a model used in marketing to represent an ideal, potential journey that potential customers go through before becoming actual customers. As a representation, it is also often an approximation, that helps marketing and sales teams structure their processes at scale, thus building repeatable sales and marketing tactics to convert customers.
The multi-billion music streaming company Spotify is primarily owned by its founders, Daniel Ek and Martin Lorentzon. As of 2023, Daniel Ek has 15.3% ownership of ordinary shares and 30.5% of the voting power. Martin Lorentzon has 10.9% of ordinary shares and 42.7% of the voting power. Another key shareholder is Baillie Gifford & Co, a Scottish-based money management firm (12% ownership ), followed by Tencent (8.4% ownership).
Spotify is a two-sided marketplace, running a free ad-supported service and a paid membership. Founded in 2008 with the belief that music should be universally accessible, it generated €13.25 billion in 2023. Of these revenues, 87.3%, or €11.56 billion, came from premium memberships, while over 12.6%, or €1.68 billion, came from ad-supported members. By 2023, Spotify had over 600 million users, of which 236 million were premium members and 379 million weread-supported users.
Spotify Audience Network is the underlying advertising infrastructure that supports its ad-supported user base. The Spotify Audience Network was born as the result of the acquisitions of Anchor and Megaphone. By 2023, Spotify had 379 million ad-supported users.
Spotify licensing deals affect its business model. The company runs on both a free service, which is ad-supported and a subscription premium service. They have different economics.
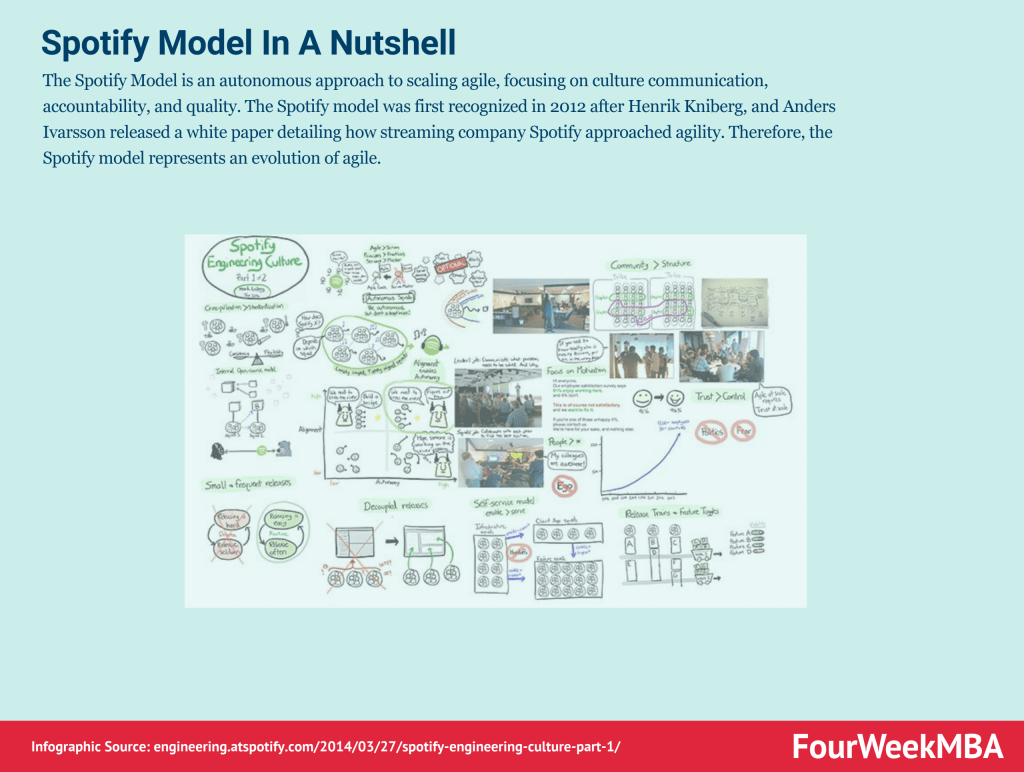
The ad-supported business had a 10% gross margin in 2021, compared to 29% of the subscription-based business. That’s because the more the content gets streamed on the platform, the more that increases royalty costs for Spotify. That is also why the company invested in developing its content. Thus, in part transitioning from platform to brand.The Spotify Model is an autonomous approach to scaling agile, focusing on culture communication, accountability, and quality. The Spotify model was first recognized in 2012 after Henrik Kniberg, and Anders Ivarsson released a white paper detailing how streaming company Spotify approached agility. Therefore, the Spotify model represents an evolution of agile.
Spotify reported a net loss of €532 million in 2023 and €430 million in 2022; it then turned profitable, with net income of €2,212 million in 2025 (Form 20-F).
Spotify generated €11.56 billion from premium members and €1.68 billion from ad-supported members. The premium membership revenue cost was €8.23 billion and €1.62B billion for the ad-supported segment. Thus, premium members generated a profit of €3.33B billion for Spotify in 2023. Meanwhile, the ad-supported segment generated a €62 million gross profit in 2023. The ad-supported segment, which is run almost at a loss, is critical for Spotify as it enables it to build a sustainable self-serving funnel to convert free users into paid subscribers!
Gennaro Cuofano is a CRO and tech executive who has worked in AI since late 2015, starting with bringing NLP, natural-language generation, voice and chatbot products to the marketing industry. His background is in law and finance: he holds a Master's degree in Law and an International MBA with an emphasis on corporate finance (LUISS Business School and the University of San Diego, 2012), and worked as a financial analyst at a real-estate investment firm in San Diego and as an assistant controller. His work focuses on business model strategy, business engineering and, more broadly, structural analysis: how companies make money, read from their own filings. He created FourWeekMBA and leads research there and at The Business Engineer, his newsletter on AI and business strategy, with over 95,000 subscribers and more than 1,000 published analyses. His writing has also appeared on Entrepreneur (for example, How to Digitize a Family Business in Europe) and HackerNoon. Find him on LinkedIn and Substack. See how we source.