The Gini coefficient is named after the Italian statistician Corrado Gini, who introduced the concept in 1912 as a way to quantify income inequality. It has since become a widely adopted tool for measuring inequality not only in income but also in wealth distribution. The Gini coefficient ranges from 0 to 1, where 0 represents perfect equality (everyone has the same income or wealth), and 1 represents perfect inequality (one person or household has all the income or wealth).
The Gini coefficient is particularly valuable because it provides a single number that summarizes the entire income or wealth distribution of a population. It can be used to compare income inequality across different countries, regions, or time periods, and to assess the effectiveness of policies aimed at reducing inequality.
The calculation of the Gini coefficient involves plotting the Lorenz curve, which is a graphical representation of income or wealth distribution. Here are the steps to calculate the Gini coefficient:
Data Collection: Gather data on the income or wealth of individuals or households in the population of interest. This data can be obtained from surveys, tax records, or other relevant sources.
Ranking: Arrange the individuals or households in ascending order based on their income or wealth. The lowest-income or least-wealthy individuals should appear first, and the highest-income or wealthiest should appear last.
Cumulative Frequency: Calculate the cumulative percentage of income or wealth for each group of individuals or households as you move up the income or wealth distribution. This involves summing the income or wealth of each group and dividing it by the total income or wealth of the entire population.
Lorenz Curve: Plot the cumulative percentage of income or wealth on the horizontal axis and the cumulative percentage of the population on the vertical axis. This creates the Lorenz curve, which represents the distribution of income or wealth.
Gini Coefficient Calculation: The Gini coefficient is calculated as the area between the Lorenz curve and the line of perfect equality (a diagonal line from the origin to the point where everyone has the same income or wealth) divided by the total area under the line of perfect equality. Mathematically, it can be expressed as: Gini Coefficient (G) = (A) / (A + B) Where:
A is the area between the Lorenz curve and the line of perfect equality.
B is the total area under the line of perfect equality.
The resulting Gini coefficient is a number between 0 and 1, with 0 indicating perfect equality and 1 indicating perfect inequality.
Interpreting the Gini Coefficient
The interpretation of the Gini coefficient is relatively straightforward:
A Gini coefficient of 0 represents perfect equality, where every individual or household has the same income or wealth.
A Gini coefficient of 1 represents perfect inequality, where one individual or household possesses all the income or wealth, and everyone else has none.
In practice, Gini coefficients for real-world income or wealth distributions fall between 0 and 1. The closer the coefficient is to 0, the more equal the distribution; the closer it is to 1, the more unequal the distribution.
Here are some general guidelines for interpreting Gini coefficients:
0.70 or above: Extremely high income or wealth inequality.
It’s important to note that Gini coefficients are relative measures and do not provide information about the overall economic well-being or absolute income or wealth levels of a population. Two populations with different Gini coefficients may have the same average income or wealth, but their distributions differ in terms of inequality.
Significance of the Gini Coefficient
The Gini coefficient has significant implications and applications in economics and public policy:
1. Inequality Assessment
The Gini coefficient is a critical tool for assessing income and wealth inequality within a society or across countries. It helps policymakers and researchers identify disparities and target interventions to address them.
2. Policy Evaluation
Governments and international organizations use the Gini coefficient to evaluate the impact of economic policies and social programs aimed at reducing inequality. Changes in the Gini coefficient over time can indicate the effectiveness of these policies.
3. International Comparisons
The Gini coefficient allows for cross-country comparisons of income and wealth inequality. It helps policymakers and researchers understand how different economic and social factors contribute to variations in inequality.
4. Resource Allocation
Understanding the Gini coefficient can inform resource allocation decisions. For example, regions or groups with higher inequality may require additional resources to address social and economic disparities.
5. Social Welfare
The Gini coefficient is linked to social welfare considerations. Higher inequality may lead to social unrest, reduced social cohesion, and decreased overall well-being. Policymakers use the Gini coefficient as a gauge of social stability.
6. Business and Investment
Companies and investors may consider the Gini coefficient when assessing market opportunities and risks. High levels of inequality can impact consumer demand, market dynamics, and political stability.
Limitations of the Gini Coefficient
While the Gini coefficient is a valuable tool for measuring income and wealth inequality, it has certain limitations:
1. Lack of Detail
The Gini coefficient provides a summary measure of inequality but does not offer detailed insights into the specific causes or sources of inequality. It does not distinguish between different types of income or wealth (e.g., earned income, capital gains, inheritance) or consider other factors like education and access to opportunities.
2. Insensitivity to Changes in the Middle
The Gini coefficient is relatively insensitive to changes in the middle of the income or wealth distribution. It may not capture shifts in inequality within the middle-income range, focusing more on extremes.
3. Data Quality
The accuracy and reliability of Gini coefficient calculations depend on the quality and representativeness of the data used. Inaccurate or incomplete data can lead to misleading results.
4. Population Groups
The Gini coefficient treats all individuals or households as equal contributors to income or wealth inequality, regardless of their size or economic significance. It does not consider variations in the contributions of different population groups.
5. Lack of Policy Prescriptions
While the Gini coefficient highlights inequality, it does not prescribe specific policy solutions. Addressing inequality often requires a more nuanced understanding of its underlying causes and potential policy interventions.
Conclusion
The Gini coefficient is a powerful tool for measuring income and wealth inequality within a population. It provides a single numerical representation of the distribution of resources, with values ranging from 0 (perfect equality) to 1 (perfect inequality). The Gini coefficient’s significance lies in its ability to assess inequality, evaluate policy effectiveness, and inform resource allocation decisions. However, it is not without limitations and should be used in conjunction with other economic and social indicators to gain a comprehensive understanding of inequality and its underlying factors. In a world where economic disparities continue to be a pressing issue, the Gini coefficient remains a crucial instrument for policymakers, researchers, and advocates seeking to address inequality and promote social equity.
The idea of a market economy first came from classical economists, including David Ricardo, Jean-Baptiste Say, and Adam Smith. All three of these economists were advocates for a free market. They argued that the “invisible hand” of market incentives and profit motives were more efficient in guiding economic decisions to prosperity than strict government planning.
Positive economics is concerned with describing and explaining economic phenomena; it is based on facts and empirical evidence. Normative economics, on the other hand, is concerned with making judgments about what “should be” done. It contains value judgments and recommendations about how the economy should be.
When there is an increased price of goods and services over a long period, it is called inflation. In these times, currency shows less potential to buy products and services. Thus, general prices of goods and services increase. Consequently, decreases in the purchasing power of currency is called inflation.
Asymmetric information as a concept has probably existed for thousands of years, but it became mainstream in 2001 after Michael Spence, George Akerlof, and Joseph Stiglitz won the Nobel Prize in Economics for their work on information asymmetry in capital markets. Asymmetric information, otherwise known as information asymmetry, occurs when one party in a business transaction has access to more information than the other party.
Autarky comes from the Greek words autos (self)and arkein (to suffice) and in essence, describes a general state of self-sufficiency. However, the term is most commonly used to describe the economic system of a nation that can operate without support from the economic systems of other nations. Autarky, therefore, is an economic system characterized by self-sufficiency and limited trade with international partners.
Creative destruction was first described by Austrian economist Joseph Schumpeter in 1942, who suggested that capital was never stationary and constantly evolving. To describe this process, Schumpeter defined creative destruction as the “process of industrial mutation that incessantly revolutionizes the economic structure from within, incessantly destroying the old one, incessantly creating a new one.” Therefore, creative destruction is the replacing of long-standing practices or procedures with more innovative, disruptive practices in capitalist markets.
Happiness economics seeks to relate economic decisions to wider measures of individual welfare than traditional measures which focus on income and wealth. Happiness economics, therefore, is the formal study of the relationship between individual satisfaction, employment, and wealth.
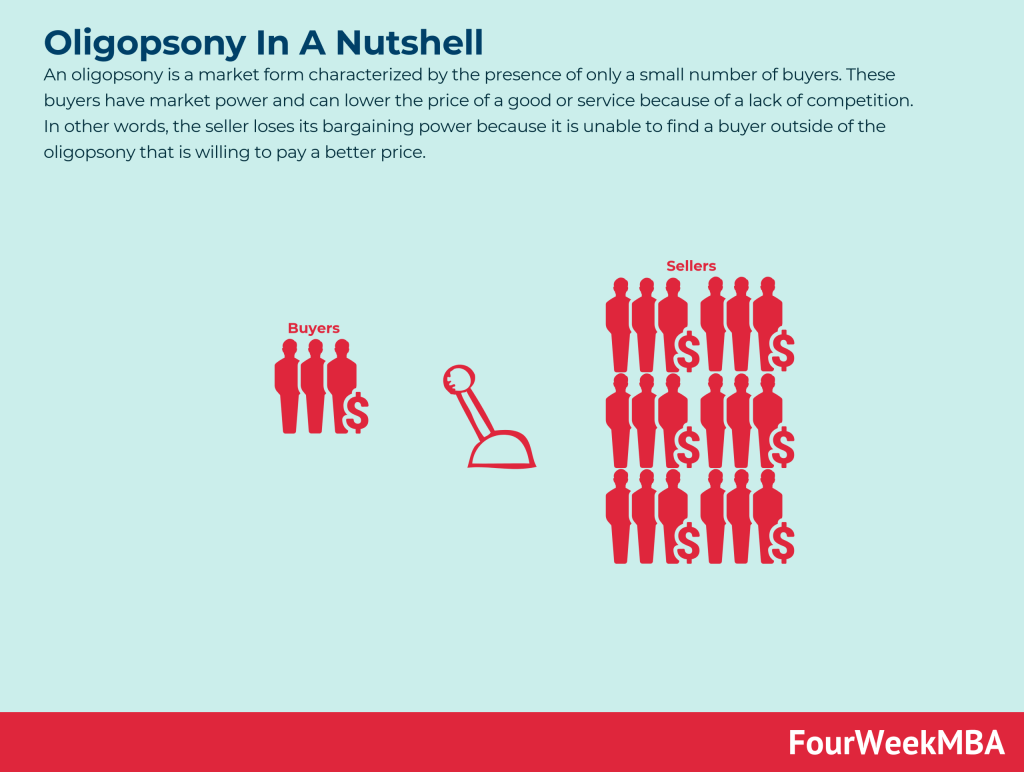
An oligopsony is a market form characterized by the presence of only a small number of buyers. These buyers have market power and can lower the price of a good or service because of a lack of competition. In other words, the seller loses its bargaining power because it is unable to find a buyer outside of the oligopsony that is willing to pay a better price.
The term “animal spirits” is derived from the Latin spiritus animalis, loosely translated as “the breath that awakens the human mind”. As far back as 300 B.C., animal spirits were used to explain psychological phenomena such as hysterias and manias. Animal spirits also appeared in literature where they exemplified qualities such as exuberance, gaiety, and courage. Thus, the term “animal spirits” is used to describe how people arrive at financial decisions during periods of economic stress or uncertainty.
State capitalism is an economic system where business and commercial activity is controlled by the state through state-owned enterprises. In a state capitalist environment, the government is the principal actor. It takes an active role in the formation, regulation, and subsidization of businesses to divert capital to state-appointed bureaucrats. In effect, the government uses capital to further its political ambitions or strengthen its leverage on the international stage.
The boom and bust cycle describes the alternating periods of economic growth and decline common in many capitalist economies. The boom and bust cycle is a phrase used to describe the fluctuations in an economy in which there is persistent expansion and contraction. Expansion is associated with prosperity, while the contraction is associated with either a recession or a depression.
The paradox of thrift was popularised by British economist John Maynard Keynes and is a central component of Keynesian economics. Proponents of Keynesian economics believe the proper response to a recession is more spending, more risk-taking, and less saving. They also believe that spending, otherwise known as consumption, drives economic growth. The paradox of thrift, therefore, is an economic theory arguing that personal savings are a net drag on the economy during a recession.
In simplistic terms, the circular flow model describes the mutually beneficial exchange of money between the two most vital parts of an economy: households, firms and how money moves between them. The circular flow model describes money as it moves through various aspects of society in a cyclical process.
Trade deficits occur when a country’s imports outweigh its exports over a specific period. Experts also refer to this as a negative balance of trade. Most of the time, trade balances are calculated based on a variety of different categories.
A market type is a way a given group of consumers and producers interact, based on the context determined by the readiness of consumers to understand the product, the complexity of the product; how big is the existing market and how much it can potentially expand in the future.
Rational choice theory states that an individual uses rational calculations to make rational choices that are most in line with their personal preferences. Rational choice theory refers to a set of guidelines that explain economic and social behavior. The theory has two underlying assumptions, which are completeness (individuals have access to a set of alternatives among they can equally choose) and transitivity.
The peer-to-peer (P2P) economy is one where buyers and sellers interact directly without the need for an intermediary third party or other business. The peer-to-peer economy is a business model where two individuals buy and sell products and services directly. In a peer-to-peer company, the seller has the ability to create the product or offer the service themselves.
The term “knowledge economy” was first coined in the 1960s by Peter Drucker. The management consultant used the term to describe a shift from traditional economies, where there was a reliance on unskilled labor and primary production, to economies reliant on service industries and jobs requiring more thinking and data analysis. The knowledge economy is a system of consumption and production based on knowledge-intensive activities that contribute to scientific and technical innovation.
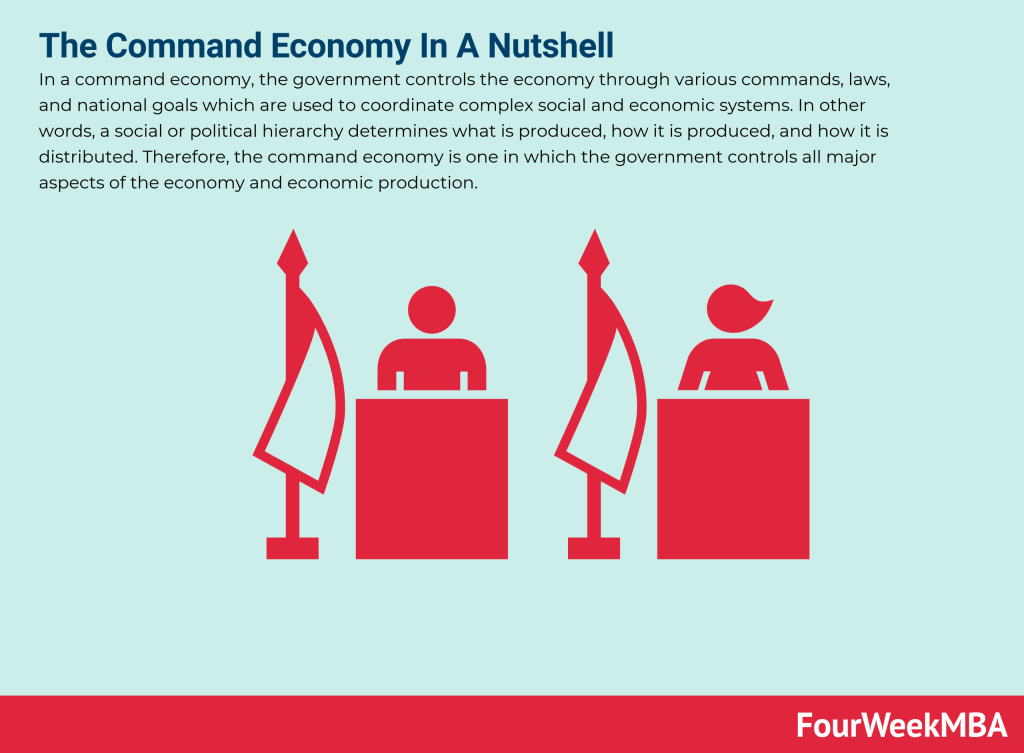
In a command economy, the government controls the economy through various commands, laws, and national goals which are used to coordinate complex social and economic systems. In other words, a social or political hierarchy determines what is produced, how it is produced, and how it is distributed. Therefore, the command economy is one in which the government controls all major aspects of the economy and economic production.
How do you protect your rights as a worker? Who is there to help defend you against unfair and unjust work conditions? Both of these questions have an answer, and it’s a solution that many are familiar with. The answer is a labor union. From construction to teaching, there are labor unions out there for just about any field of work.
The bottom of the pyramid is a term describing the largest and poorest global socio-economic group. Franklin D. Roosevelt first used the bottom of the pyramid (BOP) in a 1932 public address during the Great Depression. Roosevelt noted that – when talking about the ‘forgotten man:’ “these unhappy times call for the building of plans that rest upon the forgotten, the unorganized but the indispensable units of economic power.. that build from the bottom up and not from the top down, that put their faith once more in the forgotten man at the bottom of the economic pyramid.”
Glocalization is a portmanteau of the words “globalization” and “localization.” It is a concept that describes a globally developed and distributed product or service that is also adjusted to be suitable for sale in the local market. With the rise of the digital economy, brands now can go global by building a local footprint.
Market fragmentation is most commonly seen in growing markets, which fragment and break away from the parent market to become self-sustaining markets with different products and services. Market fragmentation is a concept suggesting that all markets are diverse and fragment into distinct customer groups over time.
The L-shaped recovery refers to an economy that declines steeply and then flatlines with weak or no growth. On a graph plotting GDP against time, this precipitous fall combined with a long period of stagnation looks like the letter “L”. The L-shaped recovery is sometimes called an L-shaped recession because the economy does not return to trend line growth. The L-shaped recovery, therefore, is a recession shape used by economists to describe different types of recessions and their subsequent recoveries. In an L-shaped recovery, the economy is characterized by a severe recession with high unemployment and near-zero economic growth.
Comparative advantage was first described by political economist David Ricardo in his book Principles of Political Economy and Taxation. Ricardo used his theory to argue against Great Britain’s protectionist laws which restricted the import of wheat from 1815 to 1846. Comparative advantage occurs when a country can produce a good or service for a lower opportunity cost than another country.
The Easterlin paradox was first described by then professor of economics at the University of Pennsylvania Richard Easterlin. In the 1970s, Easterlin found that despite the American economy experiencing growth over the previous few decades, the average level of happiness seen in American citizens remained the same. He called this the Easterlin paradox, where income and happiness correlate with each other until a certain point is reached after at least ten years or so. After this point, income and happiness levels are not significantly related. The Easterlin paradox states that happiness is positively correlated with income, but only to a certain extent.
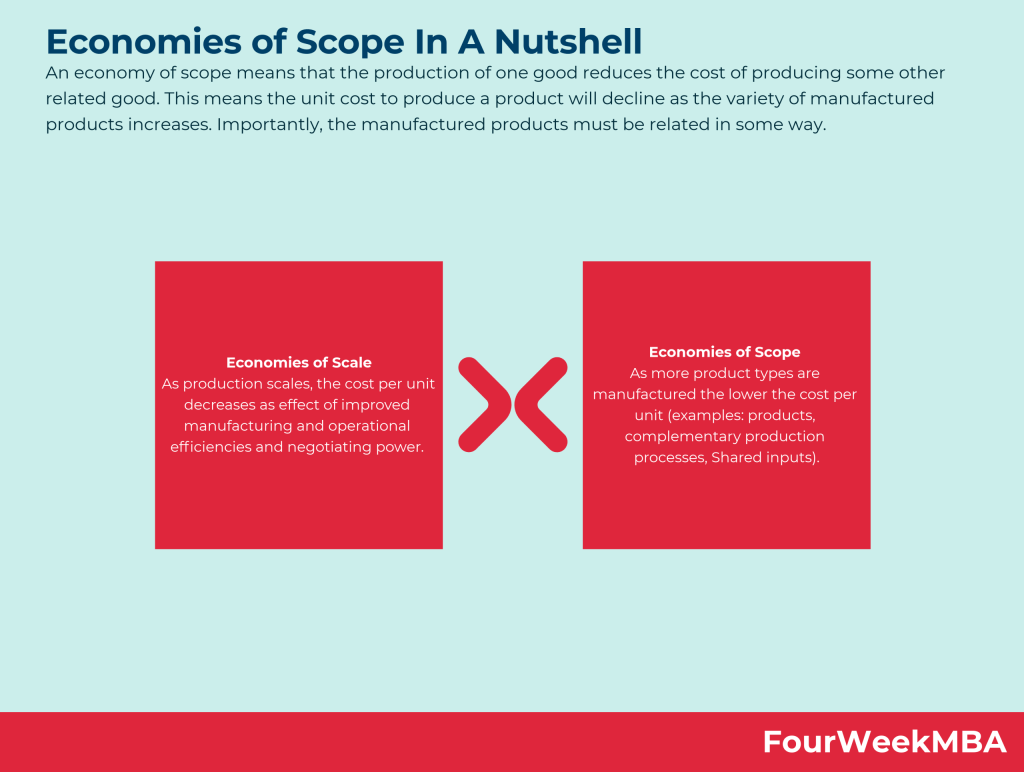
In Economics, Economies of Scale is a theory for which, as companies grow, they gain cost advantages. More precisely, companies manage to benefit from these cost advantages as they grow, due to increased efficiency in production. Thus, as companies scale and increase production, a subsequent decrease in the costs associated with it will help the organizationscale further.
In Economics, a Diseconomy of Scale happens when a company has grown so large that its costs per unit will start to increase. Thus, losing the benefits of scale. That can happen due to several factors arising as a company scales. From coordination issues to management inefficiencies and lack of proper communication flows.
An economy of scope means that the production of one good reduces the cost of producing some other related good. This means the unit cost to produce a product will decline as the variety of manufactured products increases. Importantly, the manufactured products must be related in some way.
Price sensitivity can be explained using the price elasticity of demand, a concept in economics that measures the variation in product demand as the price of the product itself varies. In consumer behavior, price sensitivity describes and measures fluctuations in product demand as the price of that product changes.
Gennaro is the creator of FourWeekMBA, which reached about four million business people, comprising C-level executives, investors, analysts, product managers, and aspiring digital entrepreneurs in 2022 alone | He is also Director of Sales for a high-tech scaleup in the AI Industry | In 2012, Gennaro earned an International MBA with emphasis on Corporate Finance and Business Strategy.