The Stakeholder Onion Diagram, also known as the Stakeholder Mapping Onion, is a visual tool used in project management and stakeholder analysis to identify and categorize stakeholders based on their level of influence, interest, and proximity to the project. The diagram consists of multiple layers, each representing a different level of stakeholder influence and interest, with the most influential and interested stakeholders positioned at the center, and less influential or interested stakeholders positioned towards the outer layers.
The purpose of the Stakeholder Onion Diagram is to provide project managers with a visual representation of stakeholder relationships and dynamics, enabling them to identify key stakeholders, understand their interests and concerns, and develop tailored communication and engagement strategies. The scope of the Stakeholder Onion Diagram encompasses various types of projects, initiatives, and organizations across different sectors and industries.
Principal Concepts
Stakeholder Analysis: The Stakeholder Onion Diagram is based on stakeholder analysis principles, which involve identifying, categorizing, and prioritizing stakeholders based on their level of influence, interest, and impact on the project.
Influence-Interest Matrix: The Stakeholder Onion Diagram is often constructed using an influence-interest matrix, where stakeholders are plotted based on their level of influence (high or low) and interest (high or low) in the project.
Theoretical Foundations of the Stakeholder Onion Diagram
The Stakeholder Onion Diagram draws on principles from various theoretical perspectives, including:
Stakeholder Theory: The Stakeholder Onion Diagram is rooted in stakeholder theory, which emphasizes the importance of identifying and managing stakeholders’ interests and relationships to achieve organizational objectives.
Systems Theory: The Stakeholder Onion Diagram applies systems theory concepts, such as system boundaries, inputs, processes, and outputs, to analyze stakeholder interactions and dynamics within the project environment.
Components of the Stakeholder Onion Diagram
The Stakeholder Onion Diagram consists of multiple layers, representing different levels of stakeholder influence and interest:
Core Stakeholders: The innermost layer of the diagram includes core stakeholders who have high levels of influence and interest in the project, such as project sponsors, key decision-makers, and primary beneficiaries.
Key Stakeholders: The middle layer of the diagram includes key stakeholders who have moderate levels of influence and interest in the project, such as project team members, strategic partners, and regulatory agencies.
Peripheral Stakeholders: The outermost layer of the diagram includes peripheral stakeholders who have low levels of influence or interest in the project, such as community members, general public, and other stakeholders with indirect or tangential connections to the project.
Applications of the Stakeholder Onion Diagram
The Stakeholder Onion Diagram has diverse applications across contexts, including:
Project Management: The Stakeholder Onion Diagram is used in project management to identify, prioritize, and engage stakeholders throughout the project lifecycle, from initiation and planning to execution and closure.
Change Management: The Stakeholder Onion Diagram is applied in change management initiatives to assess stakeholders’ readiness for change, address resistance, and build support for organizational transformations.
Industries Influenced by the Stakeholder Onion Diagram
The Stakeholder Onion Diagram has influenced a wide range of industries and sectors, including:
Construction: The Stakeholder Onion Diagram is used in construction projects to identify and engage stakeholders, such as clients, contractors, suppliers, and regulatory authorities, to ensure project success and stakeholder satisfaction.
Healthcare: The Stakeholder Onion Diagram is applied in healthcare projects to assess stakeholders’ interests and concerns, involve patients, healthcare professionals, and community organizations in decision-making processes, and improve patient outcomes and satisfaction.
Advantages of the Stakeholder Onion Diagram
Visual Representation: The Stakeholder Onion Diagram provides a visual representation of stakeholder relationships and dynamics, making it easier for project managers to understand and communicate complex stakeholder landscapes.
Prioritization: The Stakeholder Onion Diagram enables project managers to prioritize their engagement strategies and resource allocation based on stakeholders’ levels of influence and interest, focusing their efforts on key stakeholders who have the greatest impact on the project outcomes.
Challenges and Considerations in Applying the Stakeholder Onion Diagram
Despite its benefits, the Stakeholder Onion Diagram presents challenges:
Subjectivity: The Stakeholder Onion Diagram relies on subjective assessments of stakeholders’ influence and interest, which may vary depending on individuals’ perspectives, biases, and assumptions.
Dynamic Nature: Stakeholder relationships and dynamics are dynamic and may change over time, requiring project managers to regularly update and adapt the Stakeholder Onion Diagram to reflect evolving stakeholder interests and priorities.
Integration with Broader Stakeholder Engagement Strategies
To maximize the benefits of the Stakeholder Onion Diagram, it should be integrated with broader stakeholder engagement strategies:
Communication and Transparency: Integrating the Stakeholder Onion Diagram with communication and transparency initiatives to ensure stakeholders are informed, involved, and consulted throughout the project lifecycle.
Conflict Resolution: Incorporating the Stakeholder Onion Diagram into conflict resolution processes to identify and address conflicts of interest, power struggles, and communication barriers among stakeholders.
Future Directions in the Stakeholder Onion Diagram
As the Stakeholder Onion Diagram continues to evolve, future trends may include:
Digital Tools and Platforms: Developing digital tools and platforms to facilitate stakeholder mapping, visualization, and collaboration, such as interactive stakeholder mapping software and online engagement platforms.
Integration with AI and Analytics: Integrating the Stakeholder Onion Diagram with artificial intelligence (AI) and analytics technologies to analyze stakeholder data, predict stakeholder behaviors, and optimize stakeholder engagement strategies.
Conclusion
The Stakeholder Onion Diagram is a valuable tool for project managers to identify, prioritize, and engage stakeholders based on their level of influence, interest, and proximity to the project. By providing a visual representation of stakeholder relationships and dynamics, the Stakeholder Onion Diagram enables project managers to develop tailored communication and engagement strategies, allocate resources effectively, and manage stakeholder relationships to ensure project success and stakeholder satisfaction. While challenges may arise in applying the Stakeholder Onion Diagram, its benefits in promoting stakeholder engagement, transparency, and collaboration make it a valuable asset for organizations seeking to navigate complex stakeholder landscapes and achieve their project objectives.
In a functional organizational structure, groups and teams are organized based on function. Therefore, this organization follows a top-down structure, where most decision flows from top management to bottom. Thus, the bottom of the organization mostly follows the strategy detailed by the top of the organization.
In a flat organizational structure, there is little to no middle management between employees and executives. Therefore it reduces the space between employees and executives to enable an effective communication flow within the organization, thus being faster and leaner.
Project portfolio management (PPM) is a systematic approach to selecting and managing a collection of projects aligned with organizational objectives. That is a business process of managing multiple projects which can be identified, prioritized, and managed within the organization. PPM helps organizations optimize their investments by allocating resources efficiently across all initiatives.
Harvard Business School professor Dr. John Kotter has been a thought-leader on organizational change, and he developed Kotter’s 8-step change model, which helps business managers deal with organizational change. Kotter created the 8-step model to drive organizational transformation.
The Nadler-Tushman Congruence Model was created by David Nadler and Michael Tushman at Columbia University. The Nadler-Tushman Congruence Model is a diagnostic tool that identifies problem areas within a company. In the context of business, congruence occurs when the goals of different people or interest groups coincide.
McKinsey’s Seven Degrees of Freedom for Growth is a strategy tool. Developed by partners at McKinsey and Company, the tool helps businesses understand which opportunities will contribute to expansion, and therefore it helps to prioritize those initiatives.
Mintzberg’s 5Ps of Strategy is a strategy development model that examines five different perspectives (plan, ploy, pattern, position, perspective) to develop a successful business strategy. A sixth perspective has been developed over the years, called Practice, which was created to help businesses execute their strategies.
The COSO framework is a means of designing, implementing, and evaluating control within an organization. The COSO framework’s five components are control environment, risk assessment, control activities, information and communication, and monitoring activities. As a fraud risk management tool, businesses can design, implement, and evaluate internal control procedures.
The TOWS Matrix is an acronym for Threats, Opportunities, Weaknesses, and Strengths. The matrix is a variation on the SWOT Analysis, and it seeks to address criticisms of the SWOT Analysis regarding its inability to show relationships between the various categories.
Lewin’s change management model helps businesses manage the uncertainty and resistance associated with change. Kurt Lewin, one of the first academics to focus his research on group dynamics, developed a three-stage model. He proposed that the behavior of individuals happened as a function of group behavior.
OpenAI is an artificial intelligence research laboratory that transitioned into a for-profit organization in 2019. The corporate structure is organized around two entities: OpenAI, Inc., which is a single-member Delaware LLC controlled by OpenAI non-profit, And OpenAI LP, which is a capped, for-profit organization. The OpenAI LP is governed by the board of OpenAI, Inc (the foundation), which acts as a General Partner. At the same time, Limited Partners comprise employees of the LP, some of the board members, and other investors like Reid Hoffman’s charitable foundation, Khosla Ventures, and Microsoft, the leading investor in the LP.
Airbnb follows a holacracy model, or a sort of flat organizational structure, where teams are organized for projects, to move quickly and iterate fast, thus keeping a lean and flexible approach. Airbnb also moved to a hybrid model where employees can work from anywhere and meet on a quarterly basis to plan ahead, and connect to each other.
The Amazon organizational structure is predominantly hierarchical with elements of function-based structure and geographic divisions. While Amazon started as a lean, flat organization in its early years, it transitioned into a hierarchical organization with its jobs and functions clearly defined as it scaled.
The Coca-Cola Company has a somewhat complex matrix organizational structure with geographic divisions, product divisions, business-type units, and functional groups.
Costco has a matrix organizational structure, which can simply be defined as any structure that combines two or more different types. In this case, a predominant functional structure exists with a more secondary divisional structure.
Costco’s geographic divisions reflect its strong presence in the United States combined with its expanding global presence. There are six divisions in the country alone to reflect its standing as the source of most company revenue.
Compared to competitor Walmart, for example, Costco takes more a decentralized approach to management, decision-making, and autonomy. This allows the company’s stores and divisions to more flexibly respond to local market conditions.
Dell has a functional organizational structure with some degree of decentralization. This means functional departments share information, contribute ideas to the success of the organization and have some degree of decision-making power.
eBay was until recently a multi-divisional (M-form) organization with semi-autonomous units grouped according to the services they provided. Today, eBay has a single division called Marketplace, which includes eBay and its international iterations.
Facebook is characterized by a multi-faceted matrix organizational structure. The company utilizes a flat organizational structure in combination with corporate function-based teams and product-based or geographic divisions. The flat organization structure is organized around the leadership of Mark Zuckerberg, and the key executives around him. On the other hand, the function-based teams are based on the main corporate functions (like HR, product management, investor relations, and so on).
Goldman Sachs has a hierarchical structure with a clear chain of command and defined career advancement process. The structure is also underpinned by business-type divisions and function-based groups.
Google (Alphabet) has a cross-functional (team-based) organizational structure known as a matrix structure with some degree of flatness. Over the years, as the company scaled and it became a tech giant, its organizational structure is morphing more into a centralized organization.
IBM has an organizational structure characterized by product-based divisions, enabling its strategy to develop innovative and competitive products in multiple markets. IBM is also characterized by function-based segments that support product development and innovation for each product-based division, which include Global Markets, Integrated Supply Chain, Research, Development, and Intellectual Property.
McDonald’s has a divisional organizational structure where each division – based on geographical location – is assigned operational responsibilities and strategic objectives. The main geographical divisions are the US, internationally operated markets, and international developmental licensed markets. And on the other hand, the hierarchical leadership structure is organized around regional and functional divisions.
McKinsey & Company has a decentralized organizational structure with mostly self-managing offices, committees, and employees. There are also functional groups and geographic divisions with proprietary names.
Microsoft has a product-type divisional organizational structure based on functions and engineering groups. As the company scaled over time it also became more hierarchical, however still keeping its hybrid approach between functions, engineering groups, and management.
Nestlé has a geographical divisional structure with operations segmented into five key regions. For many years, Swiss multinational food and drink company Nestlé had a complex and decentralized matrix organizational structure where its numerous brands and subsidiaries were free to operate autonomously.
Nike has a matrix organizational structure incorporating geographic divisions. Nike’s matrix structure is also present at the regional and sub-regional levels. Managerial responsibility is segmented according to business unit (apparel, footwear, and equipment) and function (human resources, finance, marketing, sales, and operations).
Patagonia has a particular organizational structure, where its founder, Chouinard, disposed of the company’s ownership in the hands of two non-profits. The Patagonia Purpose Trust, holding 100% of the voting stocks, is in charge of defining the company’s strategic direction. And the Holdfast Collective, a non-profit, holds 100% of non-voting stocks, aiming to re-invest the brand’s dividends into environmental causes.
Samsung has a product-type divisional organizational structure where products determine how resources and business operations are categorized. The main resources around which Samsung’s corporate structure is organized are consumer electronics, IT, and device solutions. In addition, Samsung leadership functions are organized around a few career levels grades, based on experience (assistant, professional, senior professional, and principal professional).
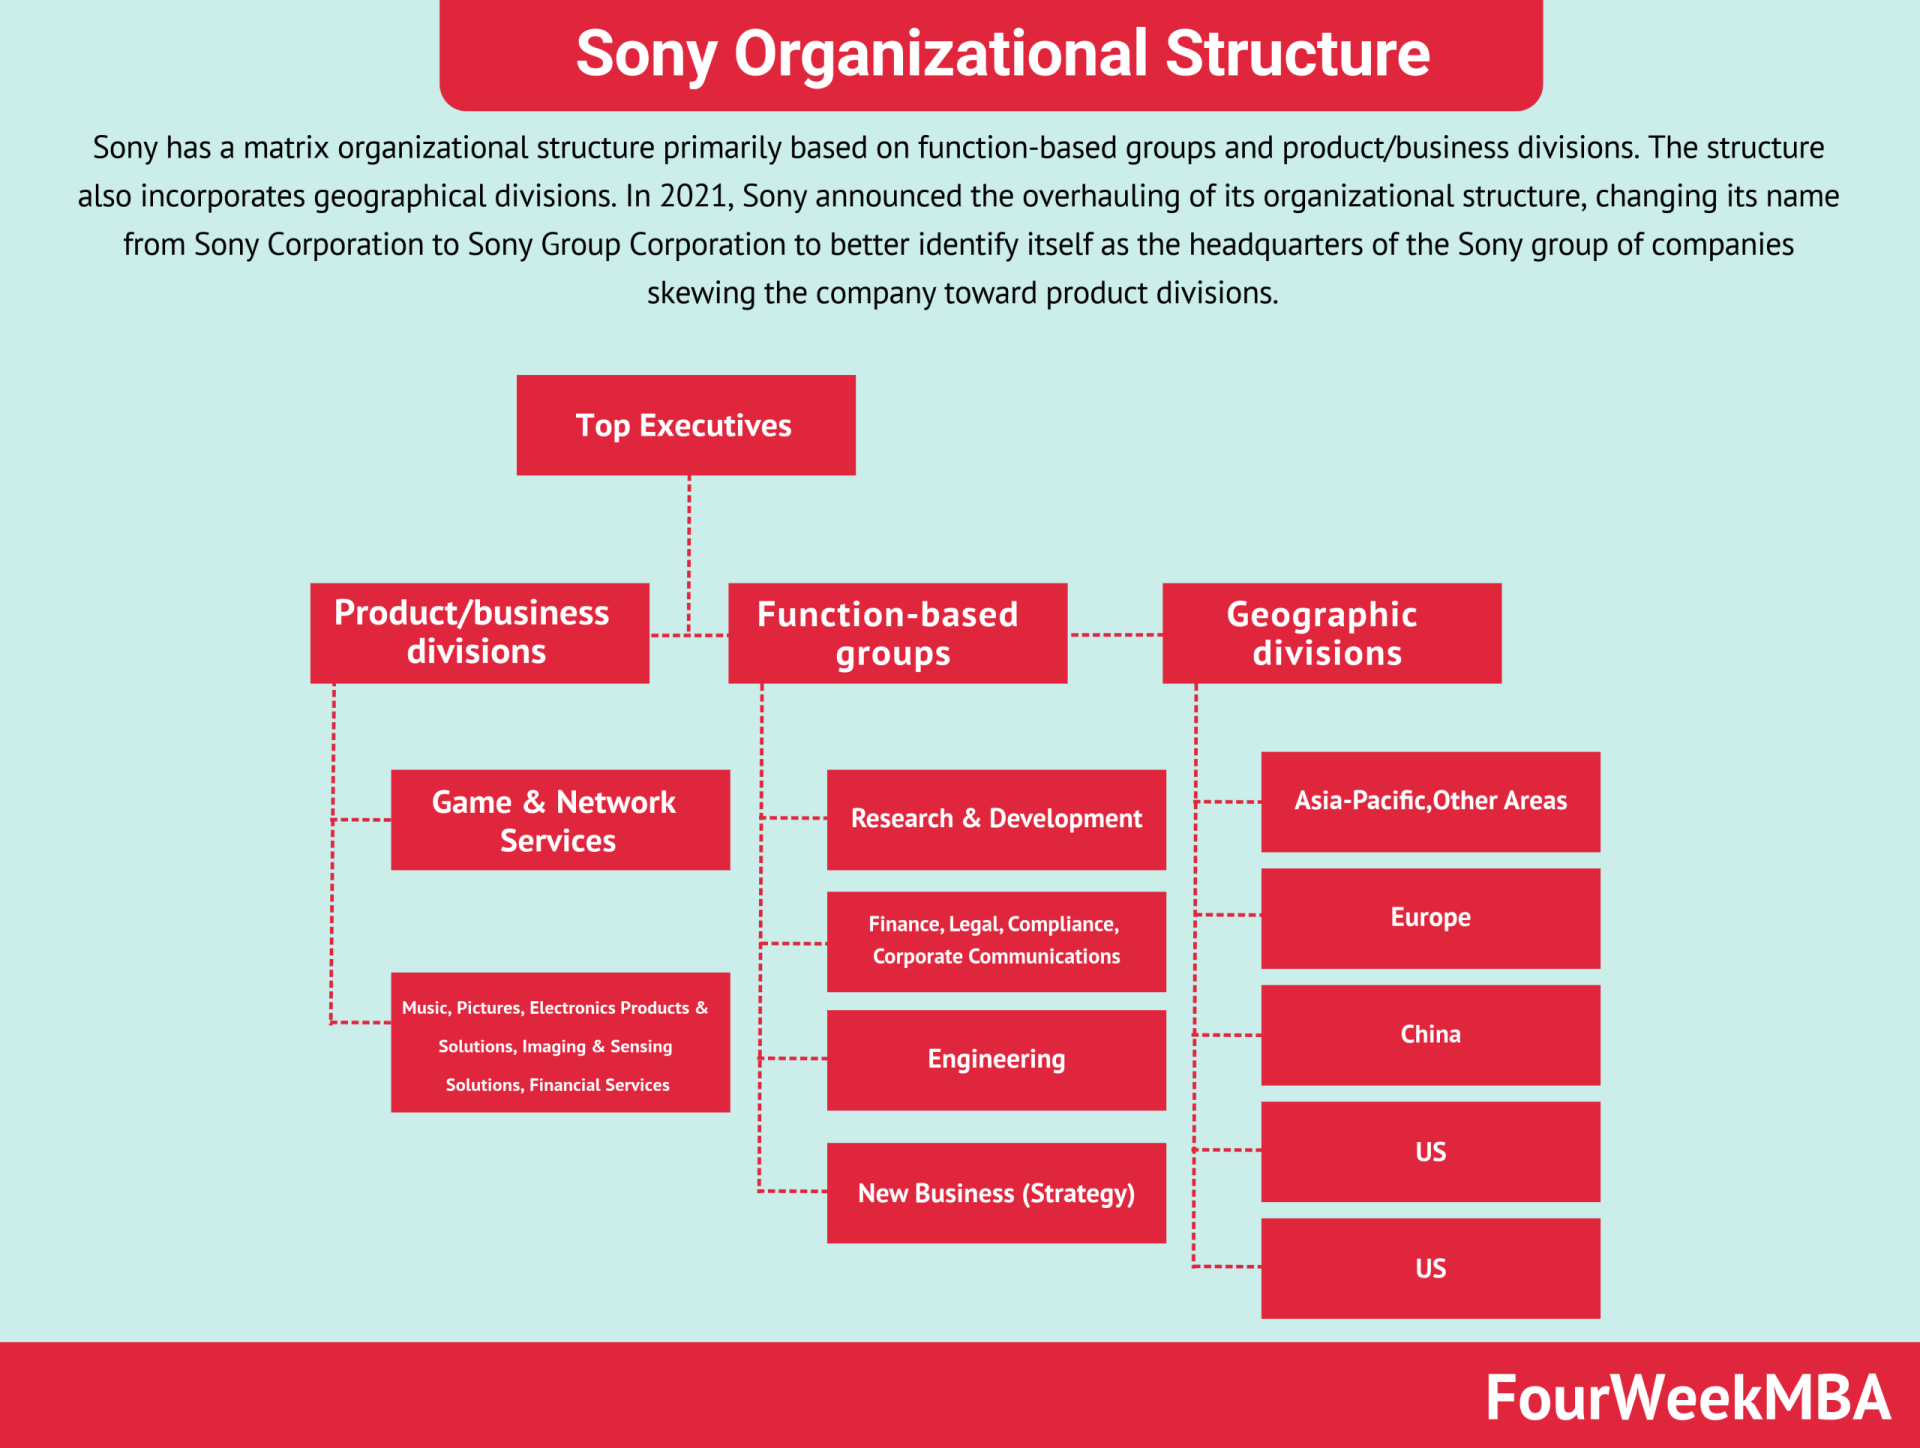
Sony has a matrix organizational structure primarily based on function-based groups and product/business divisions. The structure also incorporates geographical divisions. In 2021, Sony announced the overhauling of its organizational structure, changing its name from Sony Corporation to Sony Group Corporation to better identify itself as the headquarters of the Sony group of companies skewing the company toward product divisions.
Starbucks follows a matrix organizational structure with a combination of vertical and horizontal structures. It is characterized by multiple, overlapping chains of command and divisions.
Tesla is characterized by a functional organizational structure with aspects of a hierarchical structure. Tesla does employ functional centers that cover all business activities, including finance, sales, marketing, technology, engineering, design, and the offices of the CEO and chairperson. Tesla’s headquarters in Austin, Texas, decide the strategic direction of the company, with international operations given little autonomy.
Toyota has a divisional organizational structure where business operations are centered around the market, product, and geographic groups. Therefore, Toyota organizes its corporate structure around global hierarchies (most strategic decisions come from Japan’s headquarter), product-based divisions (where the organization is broken down, based on each product line), and geographical divisions (according to the geographical areas under management).
Walmart has a hybrid hierarchical-functional organizational structure, otherwise referred to as a matrix structure that combines multiple approaches. On the one hand, Walmart follows a hierarchical structure, where the current CEO Doug McMillon is the only employee without a direct superior, and directives are sent from top-level management. On the other hand, the function-based structure of Walmart is used to categorize employees according to their particular skills and experience.
Gennaro is the creator of FourWeekMBA, which reached about four million business people, comprising C-level executives, investors, analysts, product managers, and aspiring digital entrepreneurs in 2022 alone | He is also Director of Sales for a high-tech scaleup in the AI Industry | In 2012, Gennaro earned an International MBA with emphasis on Corporate Finance and Business Strategy.