The SERVPERF Model, short for “Service Performance,” is an extension and refinement of the SERVQUAL Model, which was developed by Parasuraman, Zeithaml, and Berry in the late 1980s. The SERVQUAL Model aimed to measure service quality by assessing the gap between customer expectations and perceptions. While SERVQUAL used a gap analysis approach, SERVPERF, developed by Cronin and Taylor in the 1990s, focuses solely on customers’ perceptions of service quality.
Key principles and components of the SERVPERF Model include:
Service Quality as a Perceptual Outcome: SERVPERF asserts that service quality is best measured by assessing customers’ perceptions of the service they receive, rather than comparing expectations to perceptions.
Performance-Based Measurement: The model emphasizes performance-based measurement, focusing on what customers believe the service provider has delivered in terms of quality.
Multi-Dimensional Assessment: SERVPERF identifies multiple dimensions of service quality, allowing for a more nuanced evaluation of different aspects of service.
No Expectation Comparison: Unlike SERVQUAL, SERVPERF does not involve comparing customer expectations to perceptions. It is solely focused on assessing how well the service has been delivered.
Developed by J. Joseph Cronin Jr. and Steven A. Taylor in 1992, the SERVPERF model is a simplified version of the SERVQUAL model. It measures service quality based solely on the perceptions of service performance, eliminating the need to compare expectations with perceptions.
Key Characteristics of the SERVPERF Model
Performance-Based: Focuses on actual service performance rather than customer expectations.
Simplified Measurement: Streamlines the measurement process by eliminating the expectations component.
Perception-Driven: Relies on customer perceptions to assess service quality.
Importance of the SERVPERF Model
Understanding and implementing the SERVPERF model is crucial for organizations aiming to improve service quality, customer satisfaction, and overall business performance.
Enhancing Service Quality
Performance Focus: Directly assesses the quality of service performance, providing actionable insights for improvement.
Customer-Centric: Centers on customer perceptions, ensuring that service improvements align with customer needs and preferences.
Improving Customer Satisfaction
Satisfaction Metrics: Provides a clear understanding of the factors that drive customer satisfaction.
Service Enhancements: Identifies areas for service enhancements to meet and exceed customer expectations.
Informing Business Strategy
Strategic Decisions: Informs strategic decisions related to service design, delivery, and improvement.
Competitive Advantage: Helps organizations gain a competitive advantage by delivering superior service quality.
Components of the SERVPERF Model
The SERVPERF model consists of five key dimensions that capture different aspects of service quality, similar to the SERVQUAL model.
1. Tangibles
Physical Facilities: The appearance and condition of physical facilities, equipment, and personnel.
Visual Appeal: The visual appeal and aesthetic quality of the service environment.
2. Reliability
Dependability: The ability to perform the promised service dependably and accurately.
Consistency: Consistency in service delivery, ensuring the same level of quality every time.
3. Responsiveness
Promptness: The willingness to help customers and provide prompt service.
Availability: The availability of staff to assist customers and address their needs.
4. Assurance
Competence: The knowledge and courtesy of employees and their ability to convey trust and confidence.
Security: The feeling of safety and security that customers experience during the service encounter.
5. Empathy
Individual Attention: The provision of caring, individualized attention to customers.
Understanding Needs: The ability to understand and address the specific needs and concerns of customers.
Methods to Implement the SERVPERF Model
Several methods can be used to implement the SERVPERF model effectively, each offering different strategies and tools.
1. Customer Surveys
Survey Design: Develop surveys that capture customer perceptions of service performance across the five dimensions.
Questionnaire Administration: Administer questionnaires to a representative sample of customers.
2. Data Collection and Analysis
Data Gathering: Collect data on customer perceptions through surveys, interviews, and feedback forms.
Statistical Analysis: Use statistical methods to analyze the data and identify key drivers of service quality.
3. Performance Benchmarking
Internal Benchmarking: Compare service performance across different departments or locations within the organization.
External Benchmarking: Compare service performance with industry benchmarks and competitors.
4. Continuous Monitoring
Regular Assessments: Conduct regular assessments of service performance to track improvements over time.
Feedback Loops: Establish feedback loops to continuously gather and respond to customer feedback.
5. Action Planning
Improvement Plans: Develop action plans to address areas of improvement identified through the SERVPERF assessments.
Implementation: Implement changes and monitor their impact on service quality and customer satisfaction.
Benefits of the SERVPERF Model
Implementing the SERVPERF model offers numerous benefits, enhancing service quality, customer satisfaction, and overall business performance.
Improved Service Quality
Focused Improvements: Focuses on actual service performance, providing clear targets for improvement.
Quality Metrics: Provides specific metrics to measure and track service quality.
Enhanced Customer Satisfaction
Customer Insights: Offers insights into customer perceptions and preferences, guiding service enhancements.
Prioritization: Helps prioritize areas for improvement based on their impact on service quality.
Efficient Use of Resources: Ensures that resources are allocated effectively to enhance service performance.
Competitive Advantage
Service Differentiation: Differentiates the organization by delivering superior service quality.
Customer Loyalty: Increases customer loyalty and retention through improved service experiences.
Challenges of Implementing the SERVPERF Model
Despite its benefits, implementing the SERVPERF model presents several challenges that need to be managed for successful adoption.
Data Collection
Survey Design: Designing effective surveys that accurately capture customer perceptions.
Response Rates: Achieving high response rates to ensure representative and reliable data.
Data Analysis
Statistical Expertise: Requires statistical expertise to analyze data and derive meaningful insights.
Interpretation: Interpreting the results accurately to inform decision-making.
Continuous Improvement
Sustaining Efforts: Maintaining a continuous focus on service quality improvement.
Change Management: Managing change effectively to implement service enhancements.
Resource Constraints
Resource Allocation: Allocating sufficient resources to conduct regular assessments and implement improvements.
Budget Limitations: Managing budget limitations while striving to enhance service quality.
Best Practices for Implementing the SERVPERF Model
Implementing best practices can help effectively manage and overcome challenges, maximizing the benefits of the SERVPERF model.
Design Effective Surveys
Clear Questions: Ensure survey questions are clear, concise, and relevant to the five dimensions of service quality.
Pilot Testing: Conduct pilot testing to refine the survey and improve its effectiveness.
Engage Customers
Customer Involvement: Involve customers in the survey design process to ensure it addresses their needs and concerns.
Incentives: Provide incentives to encourage customers to participate in the surveys.
Leverage Technology
Survey Tools: Use online survey tools to streamline data collection and analysis.
Data Analytics: Leverage data analytics software to analyze survey data and generate insights.
Foster a Quality Culture
Employee Training: Train employees on the importance of service quality and the SERVPERF model.
Quality Champions: Identify and empower quality champions to lead improvement initiatives.
Monitor and Review
Regular Monitoring: Conduct regular assessments to track service performance and identify trends.
Review Meetings: Hold review meetings to discuss findings and develop action plans for improvement.
Future Trends in Service Quality Measurement
Several trends are likely to shape the future of service quality measurement and the implementation of models like SERVPERF.
Digital Transformation
Real-Time Feedback: Implementing real-time feedback systems to gather customer perceptions instantly.
AI and Machine Learning: Using AI and machine learning to analyze customer feedback and predict service quality trends.
Personalized Service
Customer Segmentation: Personalizing service quality assessments based on customer segments.
Customized Surveys: Developing customized surveys that address the specific needs and preferences of different customer groups.
Integrated Measurement Systems
Holistic Measurement: Integrating SERVPERF with other measurement systems for a holistic view of service quality.
Omni-Channel Feedback: Collecting feedback across multiple channels to capture a comprehensive view of customer perceptions.
Sustainability and Social Responsibility
Sustainable Practices: Including sustainability and social responsibility as dimensions of service quality.
Ethical Considerations: Assessing the ethical implications of service delivery and incorporating them into quality assessments.
Employee Experience
Employee Feedback: Including employee feedback as part of the service quality assessment.
Workplace Environment: Assessing the impact of the workplace environment on service performance.
Conclusion
The SERVPERF model is a performance-based measurement framework that assesses service quality based on actual service performance rather than customer expectations. By understanding the key components, methods, benefits, and challenges of the SERVPERF model, organizations can develop effective strategies to improve service quality, enhance customer satisfaction, and inform business strategy. Implementing best practices such as designing effective surveys, engaging customers, leveraging technology, fostering a quality culture, and monitoring and reviewing performance can help maximize the benefits of the SERVPERF model.
In a functional organizational structure, groups and teams are organized based on function. Therefore, this organization follows a top-down structure, where most decision flows from top management to bottom. Thus, the bottom of the organization mostly follows the strategy detailed by the top of the organization.
In a flat organizational structure, there is little to no middle management between employees and executives. Therefore it reduces the space between employees and executives to enable an effective communication flow within the organization, thus being faster and leaner.
Project portfolio management (PPM) is a systematic approach to selecting and managing a collection of projects aligned with organizational objectives. That is a business process of managing multiple projects which can be identified, prioritized, and managed within the organization. PPM helps organizations optimize their investments by allocating resources efficiently across all initiatives.
Harvard Business School professor Dr. John Kotter has been a thought-leader on organizational change, and he developed Kotter’s 8-step change model, which helps business managers deal with organizational change. Kotter created the 8-step model to drive organizational transformation.
The Nadler-Tushman Congruence Model was created by David Nadler and Michael Tushman at Columbia University. The Nadler-Tushman Congruence Model is a diagnostic tool that identifies problem areas within a company. In the context of business, congruence occurs when the goals of different people or interest groups coincide.
McKinsey’s Seven Degrees of Freedom for Growth is a strategy tool. Developed by partners at McKinsey and Company, the tool helps businesses understand which opportunities will contribute to expansion, and therefore it helps to prioritize those initiatives.
Mintzberg’s 5Ps of Strategy is a strategy development model that examines five different perspectives (plan, ploy, pattern, position, perspective) to develop a successful business strategy. A sixth perspective has been developed over the years, called Practice, which was created to help businesses execute their strategies.
The COSO framework is a means of designing, implementing, and evaluating control within an organization. The COSO framework’s five components are control environment, risk assessment, control activities, information and communication, and monitoring activities. As a fraud risk management tool, businesses can design, implement, and evaluate internal control procedures.
The TOWS Matrix is an acronym for Threats, Opportunities, Weaknesses, and Strengths. The matrix is a variation on the SWOT Analysis, and it seeks to address criticisms of the SWOT Analysis regarding its inability to show relationships between the various categories.
Lewin’s change management model helps businesses manage the uncertainty and resistance associated with change. Kurt Lewin, one of the first academics to focus his research on group dynamics, developed a three-stage model. He proposed that the behavior of individuals happened as a function of group behavior.
OpenAI is an artificial intelligence research laboratory that transitioned into a for-profit organization in 2019. The corporate structure is organized around two entities: OpenAI, Inc., which is a single-member Delaware LLC controlled by OpenAI non-profit, And OpenAI LP, which is a capped, for-profit organization. The OpenAI LP is governed by the board of OpenAI, Inc (the foundation), which acts as a General Partner. At the same time, Limited Partners comprise employees of the LP, some of the board members, and other investors like Reid Hoffman’s charitable foundation, Khosla Ventures, and Microsoft, the leading investor in the LP.
Airbnb follows a holacracy model, or a sort of flat organizational structure, where teams are organized for projects, to move quickly and iterate fast, thus keeping a lean and flexible approach. Airbnb also moved to a hybrid model where employees can work from anywhere and meet on a quarterly basis to plan ahead, and connect to each other.
The Amazon organizational structure is predominantly hierarchical with elements of function-based structure and geographic divisions. While Amazon started as a lean, flat organization in its early years, it transitioned into a hierarchical organization with its jobs and functions clearly defined as it scaled.
The Coca-Cola Company has a somewhat complex matrix organizational structure with geographic divisions, product divisions, business-type units, and functional groups.
Costco has a matrix organizational structure, which can simply be defined as any structure that combines two or more different types. In this case, a predominant functional structure exists with a more secondary divisional structure.
Costco’s geographic divisions reflect its strong presence in the United States combined with its expanding global presence. There are six divisions in the country alone to reflect its standing as the source of most company revenue.
Compared to competitor Walmart, for example, Costco takes more a decentralized approach to management, decision-making, and autonomy. This allows the company’s stores and divisions to more flexibly respond to local market conditions.
Dell has a functional organizational structure with some degree of decentralization. This means functional departments share information, contribute ideas to the success of the organization and have some degree of decision-making power.
eBay was until recently a multi-divisional (M-form) organization with semi-autonomous units grouped according to the services they provided. Today, eBay has a single division called Marketplace, which includes eBay and its international iterations.
Facebook is characterized by a multi-faceted matrix organizational structure. The company utilizes a flat organizational structure in combination with corporate function-based teams and product-based or geographic divisions. The flat organization structure is organized around the leadership of Mark Zuckerberg, and the key executives around him. On the other hand, the function-based teams are based on the main corporate functions (like HR, product management, investor relations, and so on).
Goldman Sachs has a hierarchical structure with a clear chain of command and defined career advancement process. The structure is also underpinned by business-type divisions and function-based groups.
Google (Alphabet) has a cross-functional (team-based) organizational structure known as a matrix structure with some degree of flatness. Over the years, as the company scaled and it became a tech giant, its organizational structure is morphing more into a centralized organization.
IBM has an organizational structure characterized by product-based divisions, enabling its strategy to develop innovative and competitive products in multiple markets. IBM is also characterized by function-based segments that support product development and innovation for each product-based division, which include Global Markets, Integrated Supply Chain, Research, Development, and Intellectual Property.
McDonald’s has a divisional organizational structure where each division – based on geographical location – is assigned operational responsibilities and strategic objectives. The main geographical divisions are the US, internationally operated markets, and international developmental licensed markets. And on the other hand, the hierarchical leadership structure is organized around regional and functional divisions.
McKinsey & Company has a decentralized organizational structure with mostly self-managing offices, committees, and employees. There are also functional groups and geographic divisions with proprietary names.
Microsoft has a product-type divisional organizational structure based on functions and engineering groups. As the company scaled over time it also became more hierarchical, however still keeping its hybrid approach between functions, engineering groups, and management.
Nestlé has a geographical divisional structure with operations segmented into five key regions. For many years, Swiss multinational food and drink company Nestlé had a complex and decentralized matrix organizational structure where its numerous brands and subsidiaries were free to operate autonomously.
Nike has a matrix organizational structure incorporating geographic divisions. Nike’s matrix structure is also present at the regional and sub-regional levels. Managerial responsibility is segmented according to business unit (apparel, footwear, and equipment) and function (human resources, finance, marketing, sales, and operations).
Patagonia has a particular organizational structure, where its founder, Chouinard, disposed of the company’s ownership in the hands of two non-profits. The Patagonia Purpose Trust, holding 100% of the voting stocks, is in charge of defining the company’s strategic direction. And the Holdfast Collective, a non-profit, holds 100% of non-voting stocks, aiming to re-invest the brand’s dividends into environmental causes.
Samsung has a product-type divisional organizational structure where products determine how resources and business operations are categorized. The main resources around which Samsung’s corporate structure is organized are consumer electronics, IT, and device solutions. In addition, Samsung leadership functions are organized around a few career levels grades, based on experience (assistant, professional, senior professional, and principal professional).
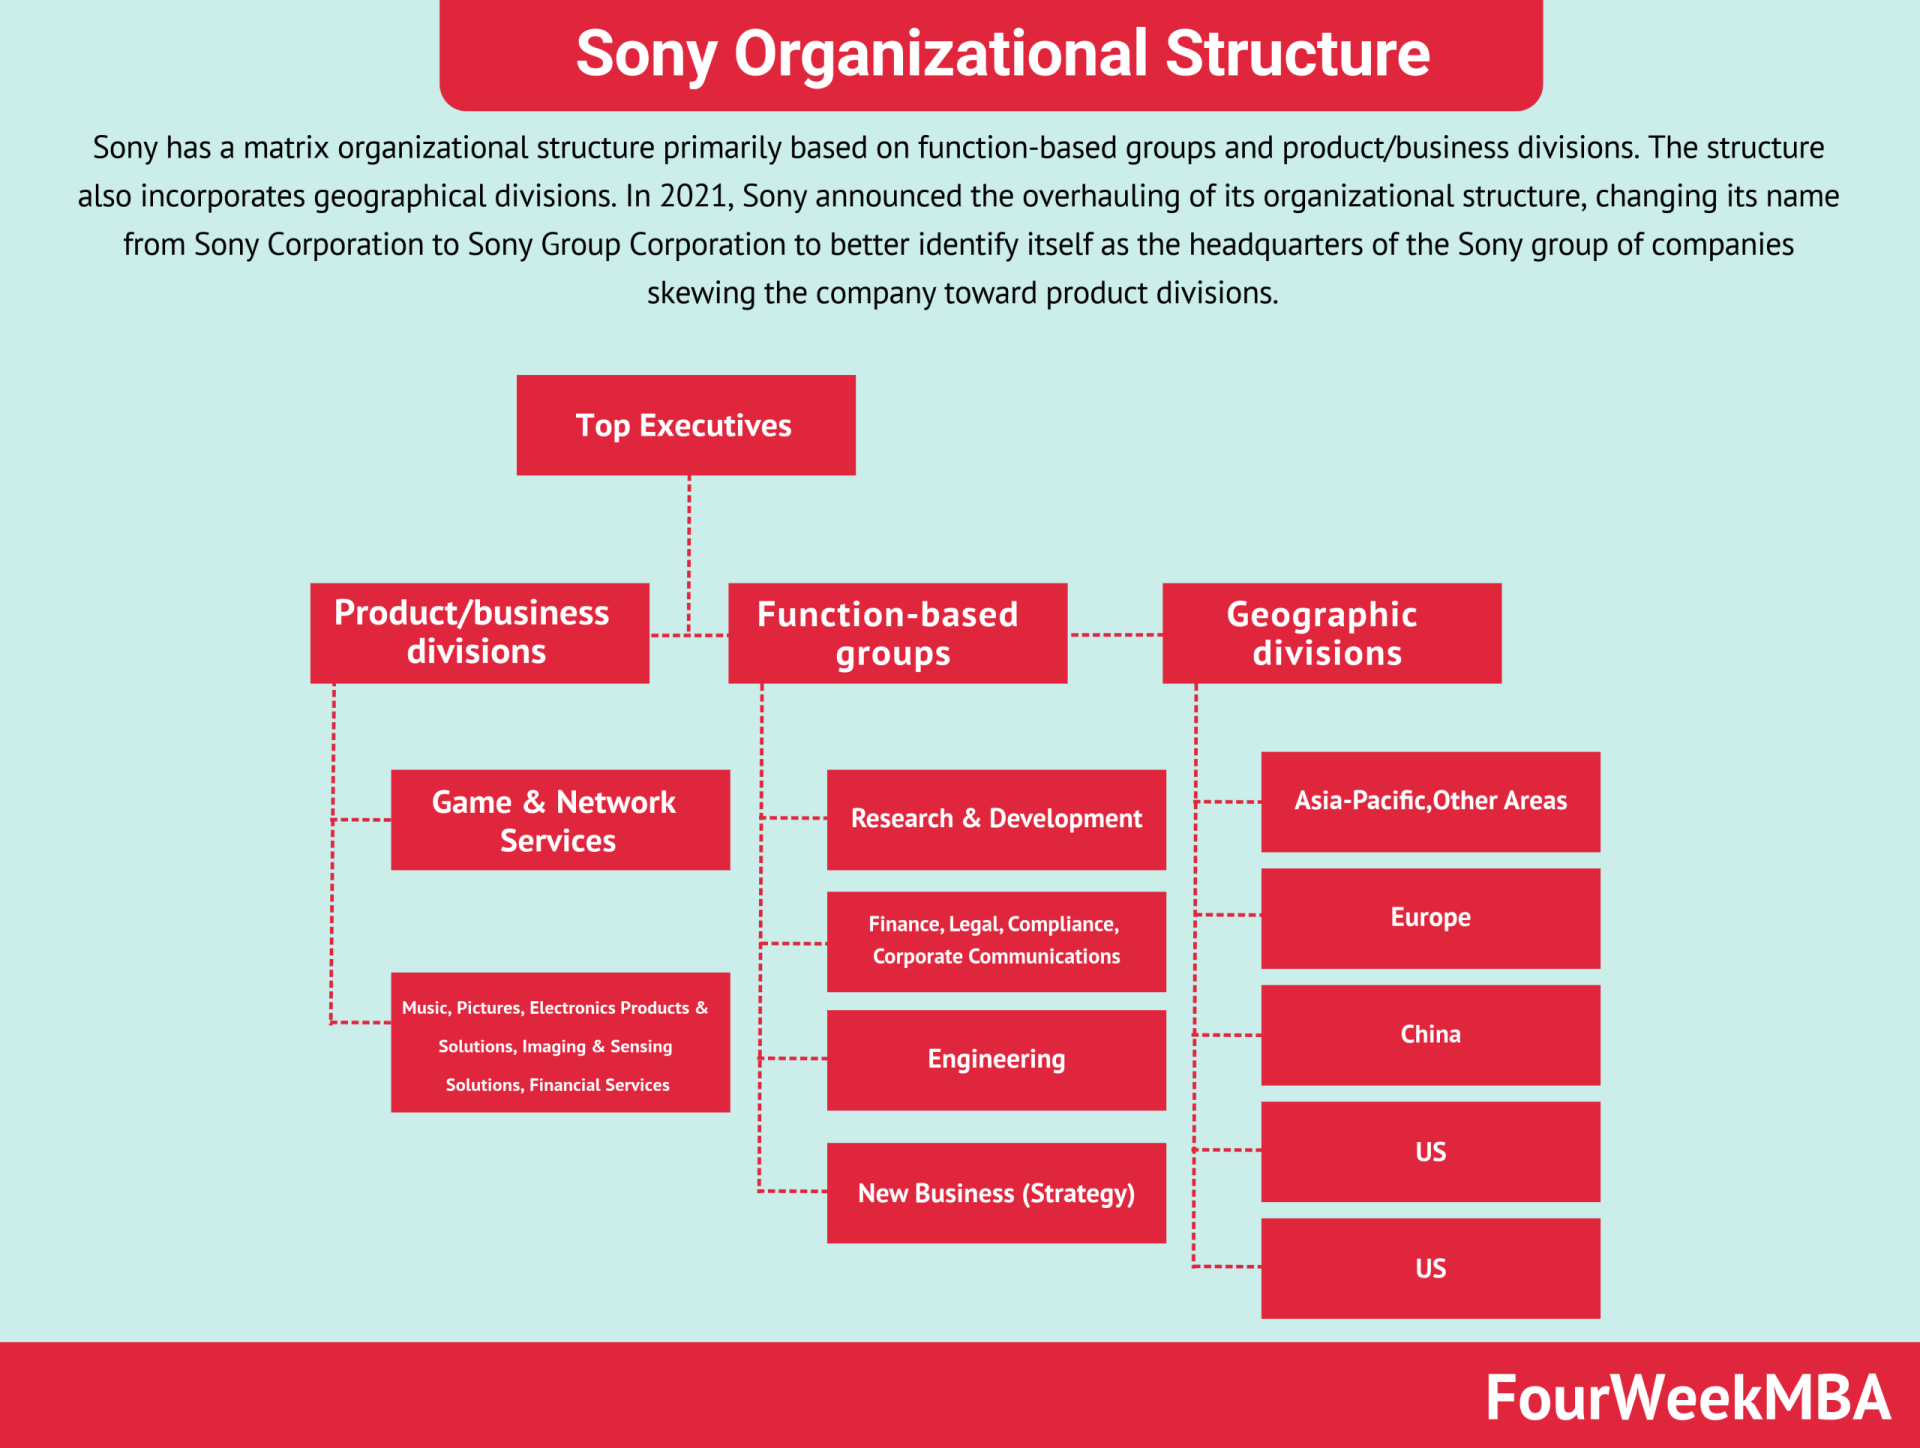
Sony has a matrix organizational structure primarily based on function-based groups and product/business divisions. The structure also incorporates geographical divisions. In 2021, Sony announced the overhauling of its organizational structure, changing its name from Sony Corporation to Sony Group Corporation to better identify itself as the headquarters of the Sony group of companies skewing the company toward product divisions.
Starbucks follows a matrix organizational structure with a combination of vertical and horizontal structures. It is characterized by multiple, overlapping chains of command and divisions.
Tesla is characterized by a functional organizational structure with aspects of a hierarchical structure. Tesla does employ functional centers that cover all business activities, including finance, sales, marketing, technology, engineering, design, and the offices of the CEO and chairperson. Tesla’s headquarters in Austin, Texas, decide the strategic direction of the company, with international operations given little autonomy.
Toyota has a divisional organizational structure where business operations are centered around the market, product, and geographic groups. Therefore, Toyota organizes its corporate structure around global hierarchies (most strategic decisions come from Japan’s headquarter), product-based divisions (where the organization is broken down, based on each product line), and geographical divisions (according to the geographical areas under management).
Walmart has a hybrid hierarchical-functional organizational structure, otherwise referred to as a matrix structure that combines multiple approaches. On the one hand, Walmart follows a hierarchical structure, where the current CEO Doug McMillon is the only employee without a direct superior, and directives are sent from top-level management. On the other hand, the function-based structure of Walmart is used to categorize employees according to their particular skills and experience.
Gennaro is the creator of FourWeekMBA, which reached about four million business people, comprising C-level executives, investors, analysts, product managers, and aspiring digital entrepreneurs in 2022 alone | He is also Director of Sales for a high-tech scaleup in the AI Industry | In 2012, Gennaro earned an International MBA with emphasis on Corporate Finance and Business Strategy.