The AI Capex Map: How $1.04 Trillion Flows Through 7 Layers
The visual below shows where every dollar of the $1.04 trillion AI compute capex will flow in 2026, mapped across seven distinct layers of the technology stack. This isn’t just spending—it’s the architectural blueprint of who controls AI infrastructure — as explored in the economics of AI compute infrastructure — and how value cascades through the ecosystem.
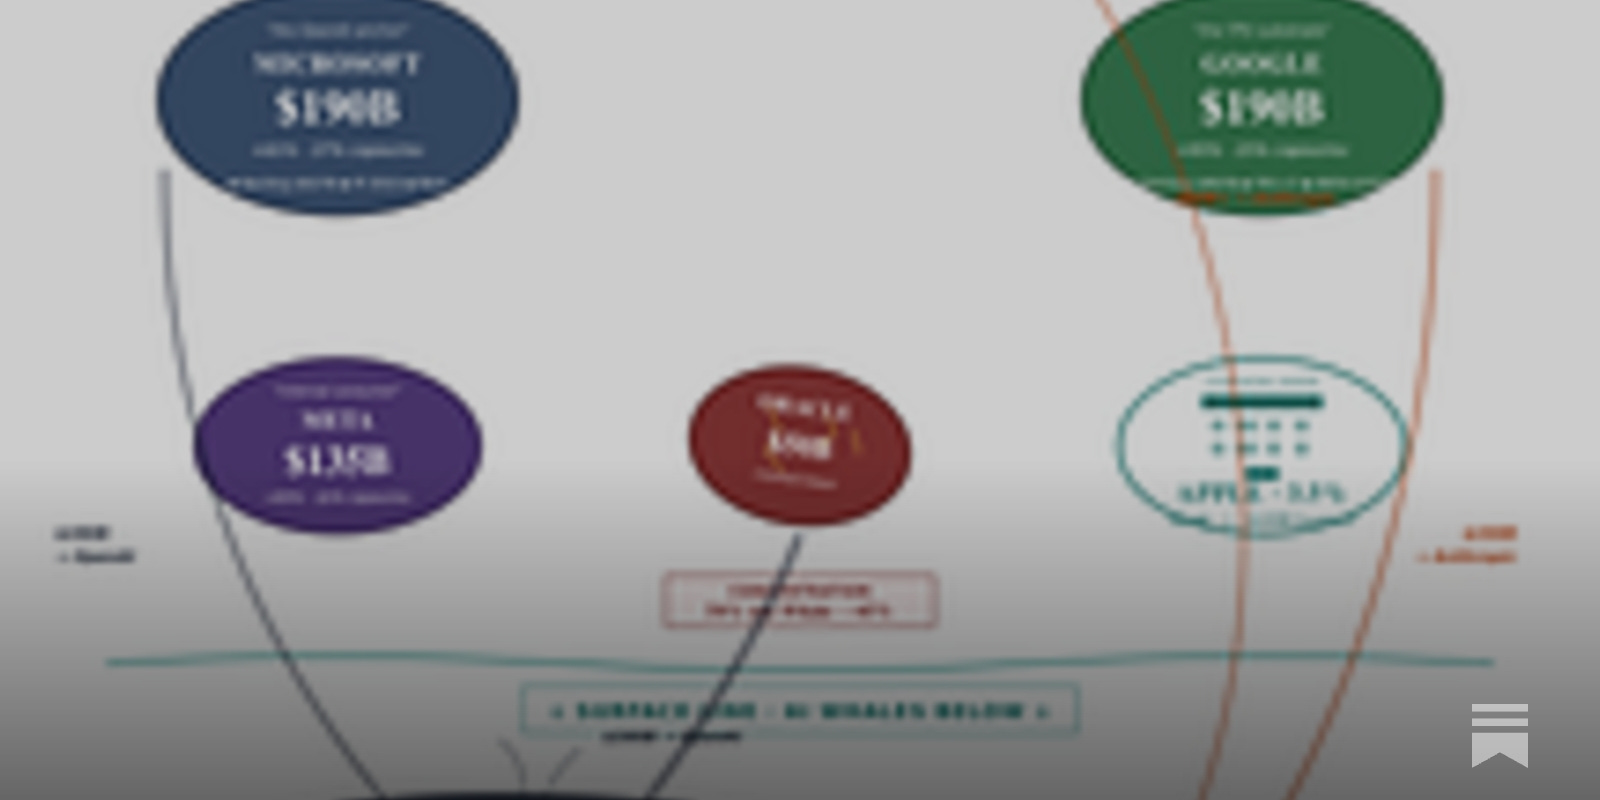
Source: The Business Engineer — AI Capex Map, May 2026
The Big Four cloud providers dominate with $725 billion in capex, representing 70% of total spending. Microsoft, Amazon, Google, and Meta are essentially building the highways that all AI traffic will travel on.
Oracle claims a surprisingly robust $50 billion slice, positioning itself as the enterprise bridge between legacy systems and AI workloads. The neoclouds—led by players like CoreWeave and Lambda Labs—secure $60 billion by serving the specialized compute needs that hyperscalers can’t address.
China’s $80 billion represents a parallel AI universe, while sovereign nations collectively invest $60 billion to avoid digital colonization. These numbers reveal more than spending patterns—they map geopolitical AI independence strategies.
The seven-layer breakdown illuminates how capex flows from foundational energy and real estate through chips and systems, up to governance and applications. Each layer captures different margins and competitive dynamics.
The energy layer foundation shows why utilities and power providers are becoming unexpected AI kingmakers. Real estate costs reveal why data center REITs trade like growth stocks.
Chip spending concentrates in NVIDIA’s ecosystem, while systems integration creates opportunities for traditional hardware players. The networking layer benefits Arista, Juniper, and specialized interconnect providers.
Software infrastructure capex flows to orchestration platforms and AI-native tooling companies. The governance layer, though smallest in absolute dollars, commands premium valuations as compliance becomes non-negotiable.
This capex map reveals three distinct business models emerging: the horizontal platforms capturing broad workloads, the vertical specialists serving specific use cases, and the sovereign players building independent stacks. Each strategy requires different capital allocation and competitive positioning.
But which layer will capture the highest returns on this trillion-dollar investment, and how will the profit pools shift as the infrastructure matures?
FREE NEWSLETTER
Get AI Strategy Intelligence Daily
Join 90,000+ strategists. Business modelanalysis, AI maps, and earnings deep dives — free.
Gennaro is the creator of FourWeekMBA, which reached about four million business people, comprising C-level executives, investors, analysts, product managers, and aspiring digital entrepreneurs in 2022 alone | He is also Director of Sales for a high-tech scaleup in the AI Industry | In 2012, Gennaro earned an International MBA with emphasis on Corporate Finance and Business Strategy.
Scroll to Top
Discover more from FourWeekMBA
Subscribe now to keep reading and get access to the full archive.