experience-curve

What Is The Experience Curve And Why It Matters In Business

The Experience Curve argues that the more experience a business has in manufacturing a product, the more it can lower costs. As a company gains un know-how, it also gains in terms of labor efficiency, technology-driven learning, product efficiency, and shared experience, to reduce the cost per unit as the cumulative volume of production increases.

AspectExplanation
Experience Curve– The Experience Curve, also known as the Learning Curve, is a concept that illustrates how the unit cost of production decreases as a result of accumulated experience and learning over time. It is based on the observation that as individuals or organizations repeat a task, they become more efficient, leading to cost reductions.
Key PrinciplesLearning Effect: The experience curve is driven by the learning effect, which posits that with each doubling of cumulative output or experience, the unit cost decreases by a constant percentage. This is typically expressed as a learning curve rate (e.g., 80% or 90%). – Cumulative Output: The experience curve is linked to the cumulative output or the total quantity produced over time. – Experience Matters: The more experience a company or individual has in producing a product or providing a service, the greater the potential for cost savings.
Applications– The experience curve concept has wide applications in various industries, including manufacturing, aerospace, technology, and services. It is particularly relevant in industries with high fixed costs and where repetition and standardization can lead to cost reductions.
Cost Reduction Factors– Several factors contribute to cost reduction along the experience curve: Efficiency improvements, process optimization, automation, skill development, error reduction, and better utilization of resources. These factors collectively lead to lower unit costs.
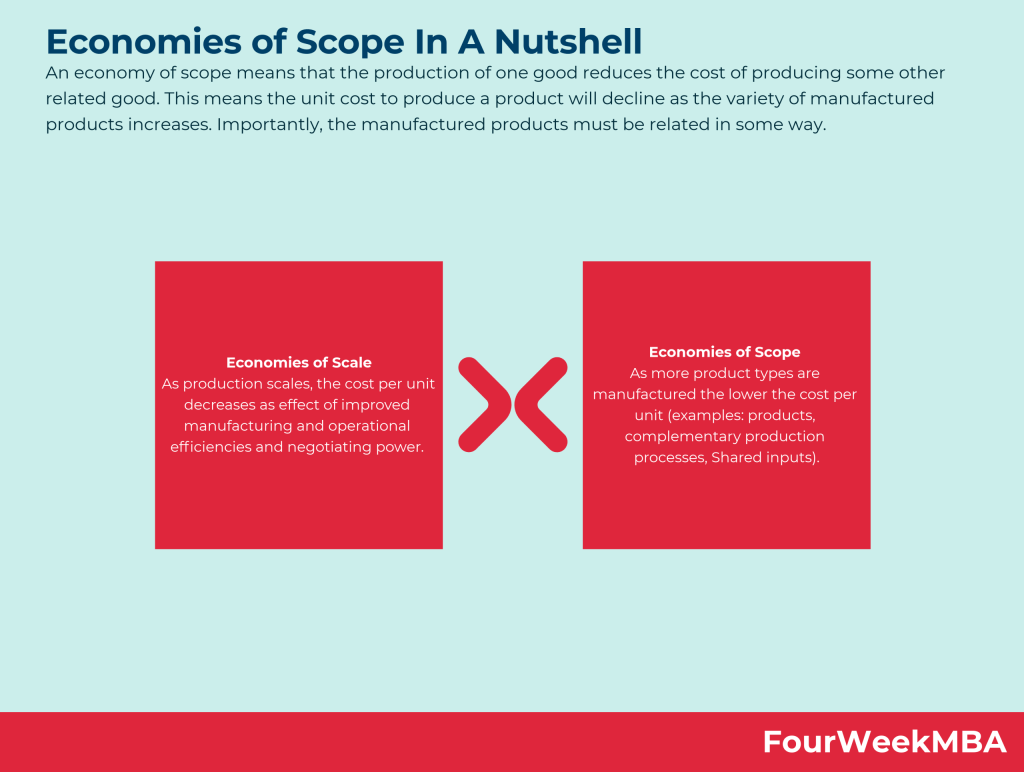
Limitations– While the experience curve is a valuable tool for cost management, it has some limitations. It assumes that the learning rate remains constant, which may not always be the case. External factors like technological advancements or market changes can disrupt the expected cost reductions. – The experience curve also doesn’t consider economies of scale, which focus on cost reductions due to increased production volume.
Competitive Advantage– Organizations that effectively leverage the experience curve can gain a competitive advantage by offering products or services at lower costs than their competitors. This can lead to price competitiveness, higher profit margins, or the ability to invest in innovation.
Strategies– Companies can employ various strategies to benefit from the experience curve, including investing in employee training, standardizing processes, adopting efficient technologies, and scaling production. – Some organizations use the experience curve to set pricing strategies that reflect their cost advantages.
Conclusion– The Experience Curve is a valuable concept for understanding how repeated experience and learning can lead to cost reductions. While it has limitations and may not apply universally, it remains a relevant tool for cost management and competitive positioning in many industries. Leveraging the experience curve can result in cost efficiencies that benefit both organizations and consumers.

Understanding the experience curve

The Experience Curve was developed in the 1960s by The Boston Consulting Group who observed the phenomenon in the manufacture of semiconductors. 

They found that the value-added production cost declined by as much as 20 to 30% each time the total manufacturing output doubled.

In this context, manufacturing output was directly related to experience. In theory, experience then allows a company to further reduce production costs and gain a competitive advantage in the process.

In terms of the fundamental core processes that power the Experience Curve, consider the following:

Labor efficiency

Employees who perform the same job repeatedly will naturally become more skilful and efficient. Confidence also grows and as a result, they make fewer errors which increases productivity.

Standardization and specialization – skilled employees with experience then contribute to standardizing processes.

They also streamline the use of required tools, techniques, and materials.

Technology-driven learning

With more time, streamlined processes are fed into technology, further increasing the level of experience that a business has in manufacturing a product.

Product efficiency

When a company has enough experience to bulk produce goods and services, they achieve product and thus cost efficiency.

Shared experience effect

At this point, the company can apply their skill and experience in manufacturing one product into the manufacture of a related product.

This potentially shortens the learning curve and fast tracks their ability to reduce costs with experience.

Examples of the Experience Curve

Perhaps the most well-known example of the Experience Curve can be seen in the development of the Model T Ford. 

With the benefit of 11 years of assembly experience, Ford cut production costs of the Model T and increased its market share from 10% to 55%.

This was achieved by modernizing plants, vertical integration and eliminating model changes.

Ford even went as far offering the Model T in black only, since black paint dried the quickest and therefore increased the speed of production.

Contact lens maker Bausch & Lomb consolidated their market position by computerizing lens design and expanding their plant to facilitate greater productivity.

Arc welding supply company Lincoln Electric also encouraged experienced employees to create policies that would increase efficiency.

Limitations to the Experience Curve

The Experience Curve does suffer from limitations, particularly if certain aspects of the business are mismanaged. 

Potential limitations include:

  • A lack of mentors or skilled employees who can contribute their experience to improving company processes.
  • Mistaking the Experience Curve with future potential. While the curve does lead to reduced costs, it does not make any guarantees. Companies with poor management who suffer from negative external factors may find it difficult to reduce costs significantly.
  • Reliance on product relevancy. When a product becomes obsolete or falls out of favour with consumers, any cost reduction the company previously enjoyed will be eroded due to falling sales and lower profits. The company must then start the process again.

Further experience curve examples

Texas Instruments

Texas Instruments (TI) is an American manufacturer of semiconductors and various integrated circuits that was founded in 1930 by Eugene McDermott, J. Erik Jonsson, Patrick E. Haggerty, and Cecil Howard Green.

During the early 1970s, advances in hand-held calculator technology and sizeable price-sensitive demand provided an ideal opportunity for the company to adopt an experience curve strategy.

When Texas Instruments entered the market and implemented the strategy in 1972, calculator unit costs dropped from a number in the thousands to under $10 in around a decade.

In response, pent-up demand caused sales to skyrocket and, since the company was an experienced-based cost leader, its competitive advantage was impossible to overcome.

The example of Texas Instruments shows that experience curve strategies are particularly effective when there is extreme demand sensitivity to fluctuations in price.

Once the company was able to lower prices, the additional demand accelerated progress along the curve and enabled TI to rapidly increase output.

This output then decreased manufacturing costs further, which caused calculator prices to decrease and demand to increase in a positive feedback loop.

Oil and gas exploration

The effect of the experience curve has also been studied in the context of oil and gas exploration companies.

During the early years of the shale boom which began in the United States in the 1950s, the number of wells that were drilled with no resources discovered was as high as 45%.

By 2010, however, the percentage of oil and gas wells that were drilled dry had dramatically reduced to just 10%.

Cost reduction improvements were driven by several factors:

  • Incremental advances in technology.
  • Increased familiarity with crews and engineering, and
  • Reduced geologic uncertainty.

Using shale oil and gas development as an example, researchers were able to estimate an acceptable range of marginal costs for geothermal field development.

These costs were then combined with development cost estimates for specific enhanced geothermal systems (EGS) projects. In the process, researchers wanted to know the levelized cost of electricity (LCOE) for various project based on the total number of wells drilled.

The study concluded that there was significant cost reduction potential for EGS projects as a whole.

Taking into account reasonable cost assumptions and a multi-stage completion well design, researchers determined the unsubsidized LCOE for various projects at different stages of maturity. 

The results showed that the initial costs relative to market prices were high. However, the experience curve defined a clear path to developing cost-competitive EGS projects without having to rely on technological breakthroughs.

In markets where electricity prices were low, the study admitted that cost-competitiveness may take hundreds of wells to achieve.

But in favorable markets characterized by expensive electricity and an established carbon market, the experience curve would allow new ESG projects to become cost competitive in just a few iterations.

This, researchers suggested, would help dispel the myth that the costs of geothermal and ESG projects did not decrease reliably to a point where they could compete with other resources. 

In fact, the reduced exploration risk of ESG projects enabled a manufacturing approach to project development where scale, learning, and innovation factors eventually resulted in impressive cost and efficiency improvements.

Key takeaways

  • The Experience Curve refers to the graphic representation of the inverse relationship between the total value-added cost of a product and the experience the company has in manufacturing it.
  • The Experience Curve is powered by at least five fundamental mechanisms that emanate from a skilled and experienced workforce. 
  • The Experience Curve has several limitations because it relies on a skilled workforce and favourable product sales.

Key Highlights:

  • The Experience Curve: The Experience Curve is a concept that asserts that as a business gains more experience in manufacturing a product, its production costs decrease. This reduction in costs is driven by various factors associated with accumulated experience.
  • Origin of the Concept: The Boston Consulting Group developed the Experience Curve in the 1960s while observing the semiconductor manufacturing industry. They noticed that as production volumes doubled, the value-added production cost declined significantly, often by 20 to 30%.
  • Mechanisms Behind the Experience Curve:
    • Labor Efficiency: Employees become more skilled and efficient through repetitive tasks, leading to reduced errors and increased productivity.
    • Standardization and Specialization: Experienced workers contribute to standardizing processes and optimizing tool usage.
    • Technology-Driven Learning: Improved processes are integrated with technology, enhancing manufacturing experience.
    • Product Efficiency: Bulk production leads to increased product and cost efficiency.
    • Shared Experience Effect: Experience gained in manufacturing one product can be applied to related products, accelerating cost reduction.
  • Examples of the Experience Curve:
    • Model T Ford: Ford’s 11 years of assembly experience enabled them to cut production costs, increase market share, and streamline operations, e.g., offering the Model T in black for faster drying.
    • Bausch & Lomb: The contact lens maker used computerization and plant expansion to boost productivity.
    • Lincoln Electric: The welding supply company encouraged experienced employees to develop policies for increased efficiency.
  • Limitations:
    • Lack of Skilled Mentors: A lack of experienced mentors can hinder the application of the Experience Curve.
    • No Guarantee of Success: While cost reduction is likely, it doesn’t guarantee success, especially if external factors are unfavorable.
    • Product Relevancy: If a product becomes obsolete, cost reductions may not lead to sustained profits.
  • Additional Examples:
    • Texas Instruments: Implemented an experience curve strategy in the calculator market, significantly reducing unit costs and dominating the industry.
    • Oil and Gas Exploration: Experience curve effects observed in the reduction of dry wells due to advancements in technology and reduced geological uncertainty.
  • Applicability in Geothermal Energy: The Experience Curve can be applied to geothermal energy projects, showing a path to cost-competitive projects through scale, learning, and innovation, particularly in markets with high electricity prices and established carbon markets.

Connected Economic Concepts

Market Economy

market-economy
The idea of a market economy first came from classical economists, including David Ricardo, Jean-Baptiste Say, and Adam Smith. All three of these economists were advocates for a free market. They argued that the “invisible hand” of market incentives and profit motives were more efficient in guiding economic decisions to prosperity than strict government planning.

Positive and Normative Economics

positive-and-normative-economics
Positive economics is concerned with describing and explaining economic phenomena; it is based on facts and empirical evidence. Normative economics, on the other hand, is concerned with making judgments about what “should be” done. It contains value judgments and recommendations about how the economy should be.

Inflation

how-does-inflation-affect-the-economy
When there is an increased price of goods and services over a long period, it is called inflation. In these times, currency shows less potential to buy products and services. Thus, general prices of goods and services increase. Consequently, decreases in the purchasing power of currency is called inflation. 

Asymmetric Information

asymmetric-information
Asymmetric information as a concept has probably existed for thousands of years, but it became mainstream in 2001 after Michael Spence, George Akerlof, and Joseph Stiglitz won the Nobel Prize in Economics for their work on information asymmetry in capital markets. Asymmetric information, otherwise known as information asymmetry, occurs when one party in a business transaction has access to more information than the other party.

Autarky

autarky
Autarky comes from the Greek words autos (self)and arkein (to suffice) and in essence, describes a general state of self-sufficiency. However, the term is most commonly used to describe the economic system of a nation that can operate without support from the economic systems of other nations. Autarky, therefore, is an economic system characterized by self-sufficiency and limited trade with international partners.

Demand-Side Economics

demand-side-economics
Demand side economics refers to a belief that economic growth and full employment are driven by the demand for products and services.

Supply-Side Economics

supply-side-economics
Supply side economics is a macroeconomic theory that posits that production or supply is the main driver of economic growth.

Creative Destruction

creative-destruction
Creative destruction was first described by Austrian economist Joseph Schumpeter in 1942, who suggested that capital was never stationary and constantly evolving. To describe this process, Schumpeter defined creative destruction as the “process of industrial mutation that incessantly revolutionizes the economic structure from within, incessantly destroying the old one, incessantly creating a new one.” Therefore, creative destruction is the replacing of long-standing practices or procedures with more innovative, disruptive practices in capitalist markets.

Happiness Economics

happiness-economics
Happiness economics seeks to relate economic decisions to wider measures of individual welfare than traditional measures which focus on income and wealth. Happiness economics, therefore, is the formal study of the relationship between individual satisfaction, employment, and wealth.

Oligopsony

oligopsony
An oligopsony is a market form characterized by the presence of only a small number of buyers. These buyers have market power and can lower the price of a good or service because of a lack of competition. In other words, the seller loses its bargaining power because it is unable to find a buyer outside of the oligopsony that is willing to pay a better price.

Animal Spirits

animal-spirits
The term “animal spirits” is derived from the Latin spiritus animalis, loosely translated as “the breath that awakens the human mind”. As far back as 300 B.C., animal spirits were used to explain psychological phenomena such as hysterias and manias. Animal spirits also appeared in literature where they exemplified qualities such as exuberance, gaiety, and courage.  Thus, the term “animal spirits” is used to describe how people arrive at financial decisions during periods of economic stress or uncertainty.

State Capitalism

state-capitalism
State capitalism is an economic system where business and commercial activity is controlled by the state through state-owned enterprises. In a state capitalist environment, the government is the principal actor. It takes an active role in the formation, regulation, and subsidization of businesses to divert capital to state-appointed bureaucrats. In effect, the government uses capital to further its political ambitions or strengthen its leverage on the international stage.

Boom And Bust Cycle

boom-and-bust-cycle
The boom and bust cycle describes the alternating periods of economic growth and decline common in many capitalist economies. The boom and bust cycle is a phrase used to describe the fluctuations in an economy in which there is persistent expansion and contraction. Expansion is associated with prosperity, while the contraction is associated with either a recession or a depression.

Paradox of Thrift

paradox-of-thrift
The paradox of thrift was popularised by British economist John Maynard Keynes and is a central component of Keynesian economics. Proponents of Keynesian economics believe the proper response to a recession is more spending, more risk-taking, and less saving. They also believe that spending, otherwise known as consumption, drives economic growth. The paradox of thrift, therefore, is an economic theory arguing that personal savings are a net drag on the economy during a recession.

Circular Flow Model

circular-flow-model
In simplistic terms, the circular flow model describes the mutually beneficial exchange of money between the two most vital parts of an economy: households, firms and how money moves between them. The circular flow model describes money as it moves through various aspects of society in a cyclical process.

Trade Deficit

trade-deficit
Trade deficits occur when a country’s imports outweigh its exports over a specific period. Experts also refer to this as a negative balance of trade. Most of the time, trade balances are calculated based on a variety of different categories.

Market Types

market-types
A market type is a way a given group of consumers and producers interact, based on the context determined by the readiness of consumers to understand the product, the complexity of the product; how big is the existing market and how much it can potentially expand in the future.

Rational Choice Theory

rational-choice-theory
Rational choice theory states that an individual uses rational calculations to make rational choices that are most in line with their personal preferences. Rational choice theory refers to a set of guidelines that explain economic and social behavior. The theory has two underlying assumptions, which are completeness (individuals have access to a set of alternatives among they can equally choose) and transitivity.

Conflict Theory

conflict-theory
Conflict theory argues that due to competition for limited resources, society is in a perpetual state of conflict.

Peer-to-Peer Economy

peer-to-peer-economy
The peer-to-peer (P2P) economy is one where buyers and sellers interact directly without the need for an intermediary third party or other business. The peer-to-peer economy is a business model where two individuals buy and sell products and services directly. In a peer-to-peer company, the seller has the ability to create the product or offer the service themselves.

Knowledge-Economy

knowledge-economy
The term “knowledge economy” was first coined in the 1960s by Peter Drucker. The management consultant used the term to describe a shift from traditional economies, where there was a reliance on unskilled labor and primary production, to economies reliant on service industries and jobs requiring more thinking and data analysis. The knowledge economy is a system of consumption and production based on knowledge-intensive activities that contribute to scientific and technical innovation.

Command Economy

command-economy
In a command economy, the government controls the economy through various commands, laws, and national goals which are used to coordinate complex social and economic systems. In other words, a social or political hierarchy determines what is produced, how it is produced, and how it is distributed. Therefore, the command economy is one in which the government controls all major aspects of the economy and economic production.

Labor Unions

labor-unions
How do you protect your rights as a worker? Who is there to help defend you against unfair and unjust work conditions? Both of these questions have an answer, and it’s a solution that many are familiar with. The answer is a labor union. From construction to teaching, there are labor unions out there for just about any field of work.

Bottom of The Pyramid

bottom-of-the-pyramid
The bottom of the pyramid is a term describing the largest and poorest global socio-economic group. Franklin D. Roosevelt first used the bottom of the pyramid (BOP) in a 1932 public address during the Great Depression. Roosevelt noted that – when talking about the ‘forgotten man:’ “these unhappy times call for the building of plans that rest upon the forgotten, the unorganized but the indispensable units of economic power.. that build from the bottom up and not from the top down, that put their faith once more in the forgotten man at the bottom of the economic pyramid.”

Glocalization

glocalization
Glocalization is a portmanteau of the words “globalization” and “localization.” It is a concept that describes a globally developed and distributed product or service that is also adjusted to be suitable for sale in the local market. With the rise of the digital economy, brands now can go global by building a local footprint.

Market Fragmentation

market-fragmentation
Market fragmentation is most commonly seen in growing markets, which fragment and break away from the parent market to become self-sustaining markets with different products and services. Market fragmentation is a concept suggesting that all markets are diverse and fragment into distinct customer groups over time.

L-Shaped Recovery

l-shaped-recovery
The L-shaped recovery refers to an economy that declines steeply and then flatlines with weak or no growth. On a graph plotting GDP against time, this precipitous fall combined with a long period of stagnation looks like the letter “L”. The L-shaped recovery is sometimes called an L-shaped recession because the economy does not return to trend line growth.  The L-shaped recovery, therefore, is a recession shape used by economists to describe different types of recessions and their subsequent recoveries. In an L-shaped recovery, the economy is characterized by a severe recession with high unemployment and near-zero economic growth.

Comparative Advantage

comparative-advantage
Comparative advantage was first described by political economist David Ricardo in his book Principles of Political Economy and Taxation. Ricardo used his theory to argue against Great Britain’s protectionist laws which restricted the import of wheat from 1815 to 1846.  Comparative advantage occurs when a country can produce a good or service for a lower opportunity cost than another country.

Easterlin Paradox

easterlin-paradox
The Easterlin paradox was first described by then professor of economics at the University of Pennsylvania Richard Easterlin. In the 1970s, Easterlin found that despite the American economy experiencing growth over the previous few decades, the average level of happiness seen in American citizens remained the same. He called this the Easterlin paradox, where income and happiness correlate with each other until a certain point is reached after at least ten years or so. After this point, income and happiness levels are not significantly related. The Easterlin paradox states that happiness is positively correlated with income, but only to a certain extent.

Economies of Scale

economies-of-scale
In Economics, Economies of Scale is a theory for which, as companies grow, they gain cost advantages. More precisely, companies manage to benefit from these cost advantages as they grow, due to increased efficiency in production. Thus, as companies scale and increase production, a subsequent decrease in the costs associated with it will help the organization scale further.

Diseconomies of Scale

diseconomies-of-scale
In Economics, a Diseconomy of Scale happens when a company has grown so large that its costs per unit will start to increase. Thus, losing the benefits of scale. That can happen due to several factors arising as a company scales. From coordination issues to management inefficiencies and lack of proper communication flows.

Economies of Scope

economies-of-scope
An economy of scope means that the production of one good reduces the cost of producing some other related good. This means the unit cost to produce a product will decline as the variety of manufactured products increases. Importantly, the manufactured products must be related in some way.

Price Sensitivity

price-sensitivity
Price sensitivity can be explained using the price elasticity of demand, a concept in economics that measures the variation in product demand as the price of the product itself varies. In consumer behavior, price sensitivity describes and measures fluctuations in product demand as the price of that product changes.

Network Effects

negative-network-effects
In a negative network effect as the network grows in usage or scale, the value of the platform might shrink. In platform business models network effects help the platform become more valuable for the next user joining. In negative network effects (congestion or pollution) reduce the value of the platform for the next user joining. 

Negative Network Effects

negative-network-effects
In a negative network effect as the network grows in usage or scale, the value of the platform might shrink. In platform business models network effects help the platform become more valuable for the next user joining. In negative network effects (congestion or pollution) reduce the value of the platform for the next user joining. 

Main Free Guides:

Discover more from FourWeekMBA

Subscribe now to keep reading and get access to the full archive.

Continue reading

Scroll to Top
FourWeekMBA