The judiciary antitrust hearing, in July 2020 involving the GAFA’s CEOs (Google, Amazon, Facebook, and Apple), showed how big tech companies have reached their peak in terms of influence. There has been no other time in history, where tech companies have played such a role.
This historic period, can be easily compared to the end of the 1800s and the beginning of the 1900s when new markets developed, and as a result, companies, once small (what today we would call startups) managed to become monopolies, giving rise to the most powerful businessmen in the US (Carnegie, Ford, Rockefeller, Vanderbilt).
Those men combined with their companies could control whole markets. Yet, it’s important to emphasize that while history gives us a glance into what we thought improbable was finally happening, it can’t give us specifics about what can still happen.
Therefore, those times have their own properties. History is a path known only in hindsight. Going forward we can build the path we want. Through this report we’ll look at the current state of the business models of the GAFAs, to see where they are at, and how their business models look like, as of June 2020.
Nonetheless a global pandemic which has shaken the world, big tech companies still pulled it off. And indeed they were among the winners. Beside Google, which has recorded a slowdown in its core advertising machine, we’ll see instead how all the other companies (Amazon, Apple and Facebook) kept growing.
Among those companies, the best positioned to take advantage of this suddenly changed market is Amazon, which generated even more cash from its operations. Cash invested back to further expand and strengthen its infrastructure.
The scale of those players is incredible and it spans across many industries.
Why did I put together this report?
First, in today’s world, if you’re trying to build a small business, chances are you will need to go through those giant gatekeepers, which locked in distribution for billions of users across the world. Therefore, that might be useful to know what’s the business logic behind each of them.
Second, understanding the current market landscape is fundamental also to be a more aware consumer. In an era where tech giants have become huge consumer brands, it’s important to understand how they work and why they work the way they do. There is this strong belief that technology is neutral. This is the farthest from the truth. Each of those tech giants operate according to some of their core beliefs, which are arbitrary. Those beliefs are imbued by engineers within the products’ algorithms, that at scale influence billions of people. Therefore, it’s important to realize that technology doesn’t follow a given objective path, it’s also a human choice. And as a consumer you have a saying in that.
Third, if you’re like me, you’re a very curious person, so you might want to know how those companies work, independently, from any practical necessity.
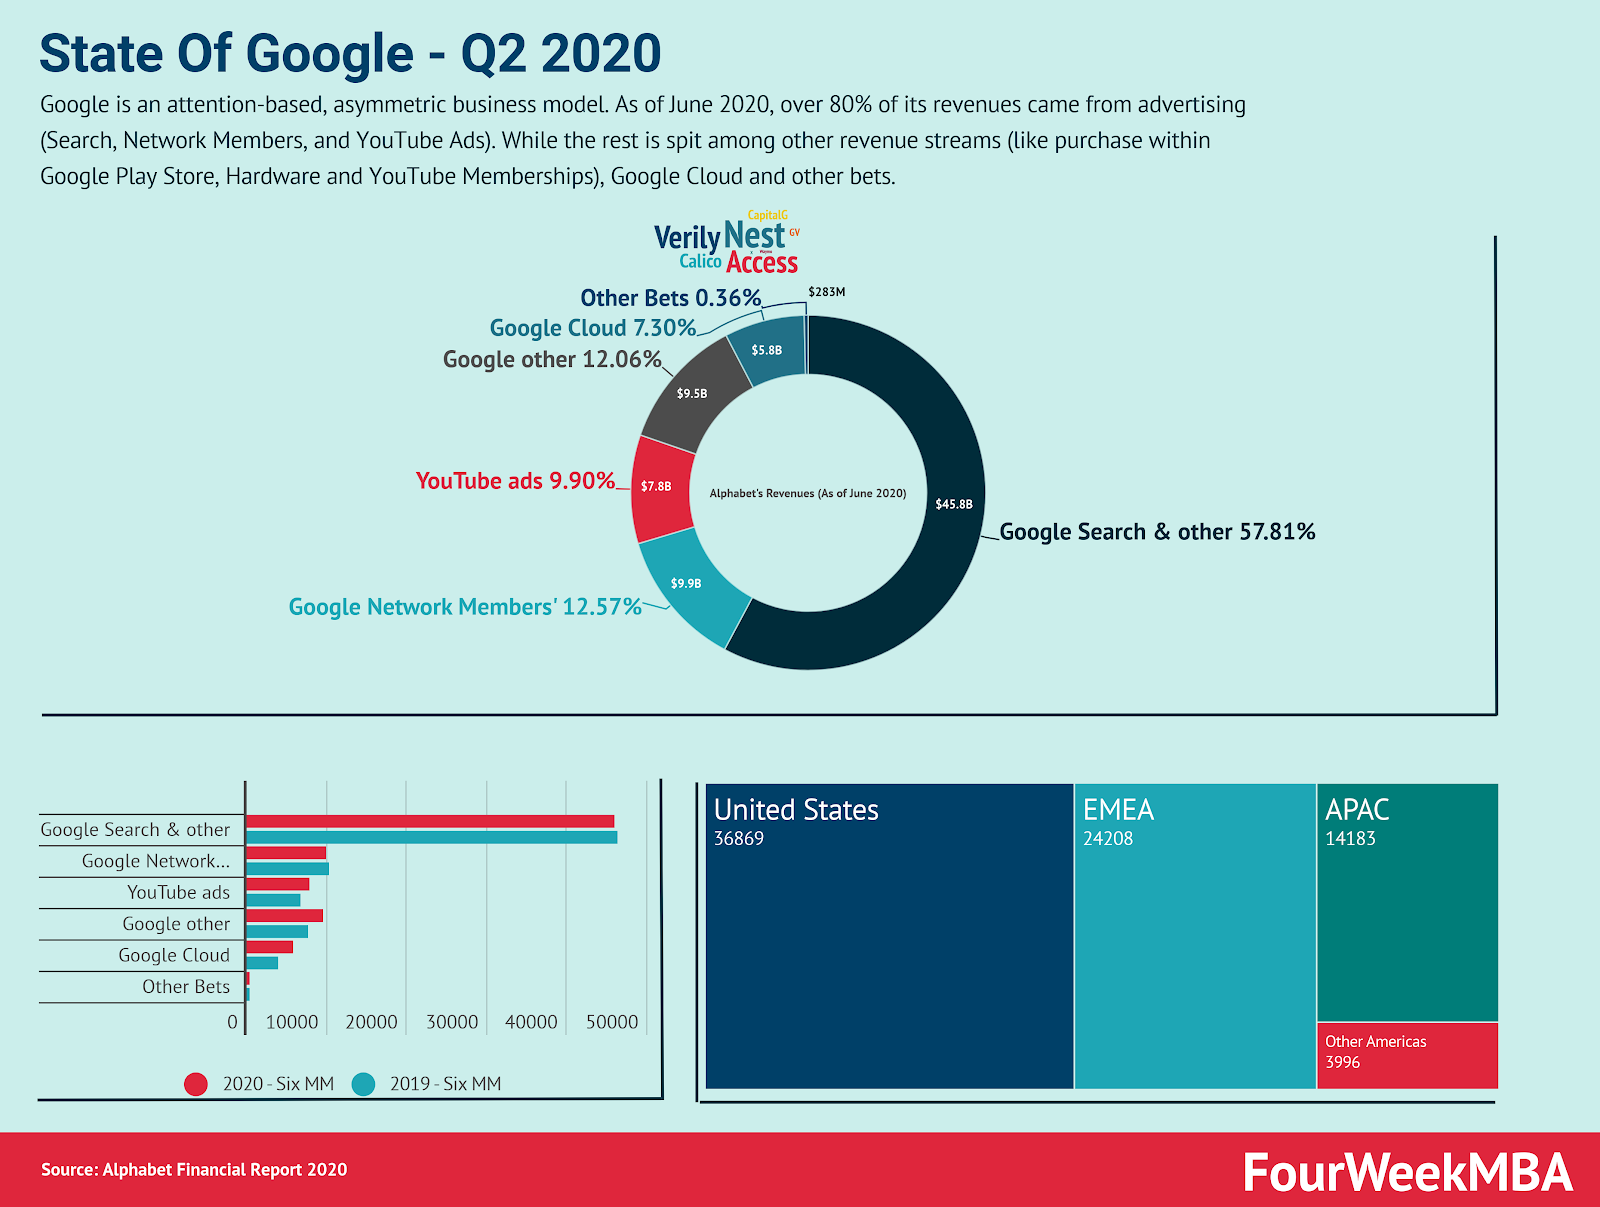
Google remains the core product for Alphabet’s business model.
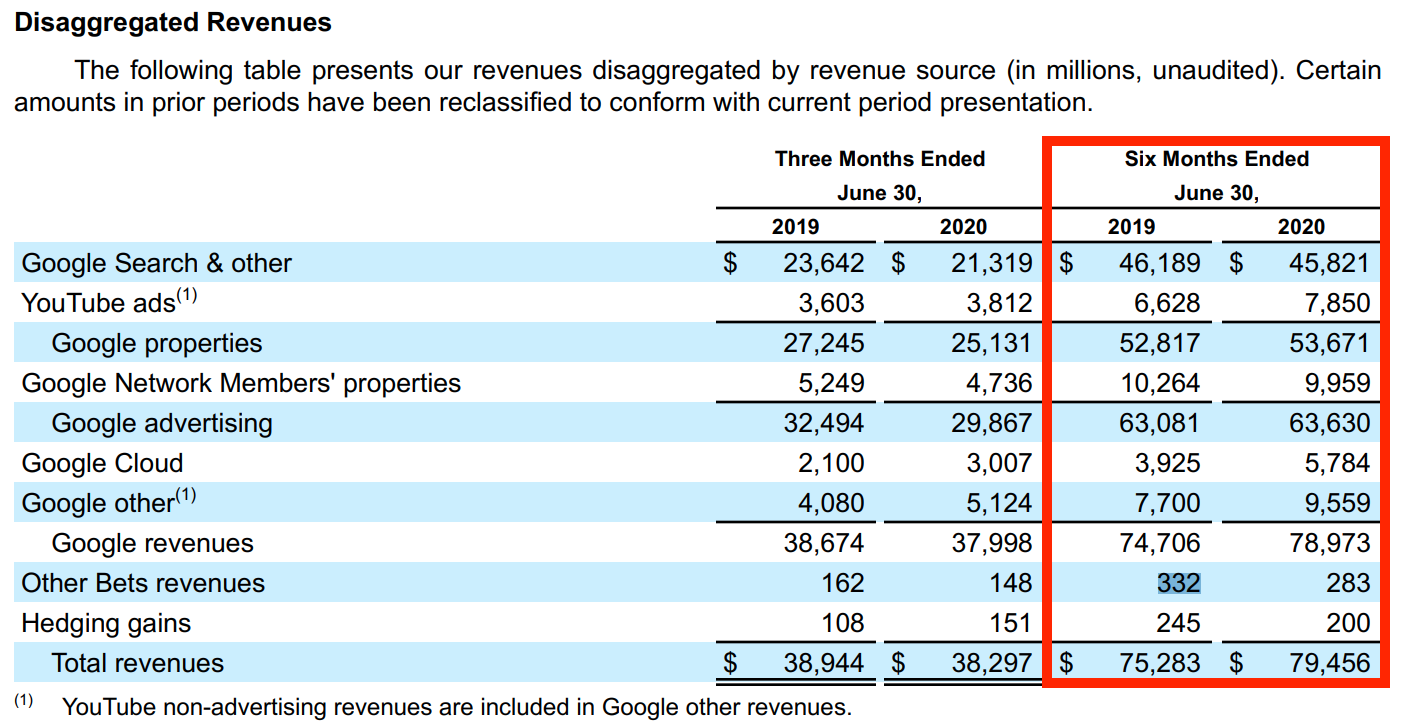
The search engine made over $55 billion in the first six months of the year 2020.
The video search engine (YouTube) made $7.8 billion in advertising revenues.
This does not include the membership revenues which are composed of Google’s revenues.
Google search and Google network members revenues slightly decreased in the first six months of 2020, compared to 2019. (get a detailed report to see what caused the decrease).
The segments that grew were YouTube Ads, Google Other revenues (comprising purchases in Google Play Store, Hardware and YouTube Subscriptions).
Other bets also decreased, while Waymo, one of the other Google’s bets, finalized another important round of investment.
In July 2020, Alphabet committed $4.5 billion to invest in India’s Reliance Jio Platforms. The Indian media giant. This is in line with Alphabet’s strategy to create a strong presence in India. It was also an important move to compete with Facebook prior investment, a few weeks before.
Detailed report
Google’s revenues are primary made of:
Advertising on Google’s properties (Google Ads).
Advertising on Google’s network members properties (Google AdSense for websites and Google AdMob for apps in the Play store).
YouTube Ads.
Google Cloud.
Other Bets.
What caused Google’s advertising revenues to decline?
For the quarter ended June 30, 2020, Google’s advertising revenues declined compared to the prior year due to the impacts of COVID-19 causing reductions in global economic activity.
Google Search & other (all these produced on Google’s properties) revenues decreased by $2.3 billion in the first three months of 2020, compared to 2019. Beginning in March of 2020, the effects of COVID-19 on both desktop and mobile search led to a decline in revenues when, despite an increase in user search activity, the revenues were adversely affected by a shift to less commercial topics and reduced advertiser spending.
To appreciate these changes it’s crucial to understand Google’s pipeline in terms of users’ behaviors. Indeed, search from users can be classified in three main categories:
Informational
Navigational
Transactional
Throughout the pandemic the informational search has spiked. However, transactional and commercial (users searching for commercial keys such as “buy X” or “product A”) searches decreased.
Thus causing at the same time a decrease in revenues, as the keywords searched by users were less valuable for advertisers on Google’s Ads platform.
However, in the second quarter of the year, things started to stabilize. As lockdown measures got lifted (or perhaps as people started to get out), also search behavior adapted again, and it picked up.
Thus, the overall loss in revenues from advertising in the six months of 2020, compared to 2019 was around $368 millions, overall.
Google’s network members decrease
In the six months of 2020, compared to 2019, Google’s network members decreased by $305 million. This decline in revenues was primarily driven by Google Ad Manager and AdSense due to reduced advertiser spending driven by the impact of COVID-19.
YouTube advertising machine on the rise
YouTube video search engine, with its video-based advertising, showed instead not only a resilience during the pandemic. But a strong increase in revenues.
YouTube ads revenues increased by over $1.2 billion in the last six months of 2020, compared to 2019. YouTube advertising revenues increased thanks to its direct response advertising products. What caused YouTube ads revenue increase?
Improvements to ad formats and delivery and increased advertiser spending.
Understanding the dynamics of Google’s advertising machine
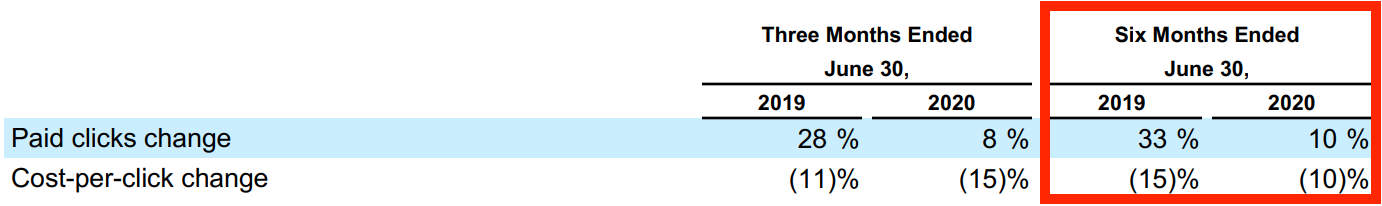
Google advertising machine is primary based on clicks. The more clicks the company is able to generate toward advertisers’ websites, the more it will make money through its Google Ads machine.
Yet, for those clicks to be valuable for both the advertiser and Google, it needs to drive qualified traffic, while Google is able to keep the click cost for advertisers constant. However, in the first part of the year:
As users’ traffic patterns changed from commercial keywords to informational keywords, the overall traffic spiked, yet the value of the traffic decreased.
In addition, advertisers reduced their budgets.
And Alphabet’s new ad formats (YouTube perhaps) determined an increased in paid clicks, but a decrease in value per click.
In short, while paid clicks increased on Google – driven by growth in views of YouTube engagement ads; an increase in clicks due to search queries resulting from ongoing growth in user adoption and usage, primarily on mobile devices; and improvements in ad formats and delivery – the cost per click for advertisers decreased, thus also reducing Google advertising revenues.
What caused the decrease in cost-per-click advertising?
To recap, three main factors influenced cost-per-click decrease:
Less commercial topics during the pandemic (people searched for information on any topics, but less commercial keywords).
Reduced advertiser spending in response to COVID-19 (many large companies reduced their advertising budgets substantially).
Continued growth in YouTube engagement ads where cost-per-click remaining lower than on our other advertising platforms. Indeed, as the YouTube advertising formats are still relatively young compared to Google’s search ads formats, they are also – so far – less competitive, therefore still have a lower cost, compared to traditional search.
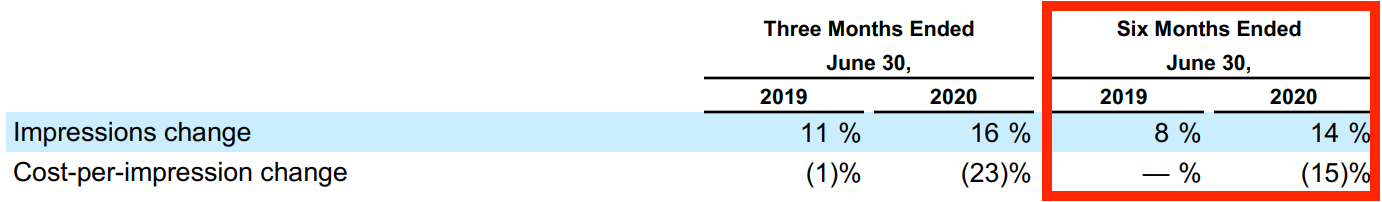
Google’s isn’t just, what we can call, a last-mile advertising machine, but also a digital branding machine. When users see brands’ names on the search results pages, those count as impressions.
Overall, by June 2020, impressions count increased by 14% compared to 2019, yet the cost-per-impression decreased, thus resulting in a negative change.
What caused it?
While increased impressions had a positive effect on revenues, the reduced budget of advertisers (especially on branding activities) reduced the overall revenues for the company.
Inside Google’s cloud business
Google Cloud revenues are made of offerings from:
Google Cloud Platform (“GCP”) which includes infrastructure, data and analytics, and other services;
G Suite productivity tools;
Other enterprise cloud services.
Google’s Cloud revenues increased by $1.8 in the six months ended June 30, 2020, compared to the same period in 2019. GCP and G Suite offerings drove this growth. Within GCP, infrastructure, data and analytics platform products were the largest contributors.
Inside Google’s other revenue streams
Google other revenues are made of:
Google Play, which includes revenues from sales of apps and in-app purchases and digital content sold in the Google Play store;
Hardware, including Google Nest home products, Pixelbooks, Pixel phones and other devices;
YouTube non-advertising, including YouTube Premium and YouTube TV subscriptions and other services;
And other products and services.
Google other revenues by $1.85 billion by June 2020, compared to 2019.
The growth was primarily driven by Google Play (driven by sales of apps and in-app purchases) and YouTube subscriptions (driven by an increase in paid subscribers).
At the same time Google recorde a decrease in hardware revenues (Pixel Phones, Google Home and the rest).
Other bets
Other Bets revenues consist primarily of revenues from the sale of Access internet services and Verily licensing and R&D services.
Google’s other bets are not profitable yet.
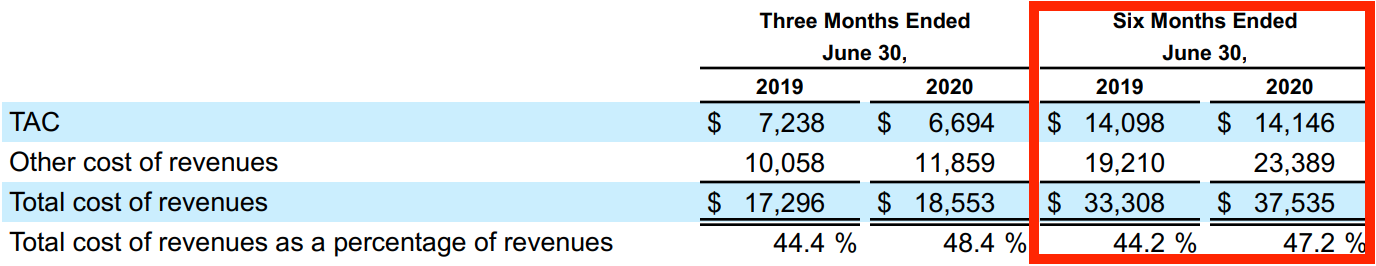
Google’s costs of sales (money spent to generate revenues)
For Google’s cost of sales, or the money the company spends to generate revenues in the first place. Those costs of sales are broken down into:
TAC: traffic acquisition costs on Google’s properties, and revenue-split with network members.
Other cost of sales (data centers, infrastructural costs and content acquisition costs).
What does influence Google’s TAC?
A key metric to look at to evaluate the health of Google in the long-term, it’s the TAC, or traffic acquisition costs.
In short, Google runs several expenses to deliver its search results in the first place, or to enable other partners to deliver advertising on their websites, as part of Google’s networks.
Therefore, we have two main types of TAC.
Partnerships, distribution (make Google the default search engine). Partnerships and distribution deals are critical to make the service accessible, and therefore collect the revenues. Perhaps, if you find Google as the default search engine on Safari, or your iPhone, that is not by chance. Behind that there is a multi-billion dollar deal, which is part of Google’s traffic acquisition costs. Those are expenses run by Google on its main properties.
Revenue-split with network members represent another important chunk of that. Indeed, Google has to split the revenues coming from the banners shown on network members websites. Therefore, if Google collects $100 on advertising revenues coming from a website part of Google’s network, a good chunk (around 70% of that) goes back to the publishers part of the network.
What does influence Google’s other cost of revenues?
Data centers and infrastructure expenses are critical to deliver the service in the first place. What non-software companies call CoGS (or cost of sales), Google calls those traffic acquisition costs. Therefore, what it takes for Google (in terms of resources) to deliver the core service, and therefore collect the revenues in the first place.
Shifting the platform to mobile also influenced the increased traffic acquisition costs, as we’ll see, as Google has to adapt to the global shift in consumers’ behavior.
Reduced traffic acquisition costs for network members, and increased cost of revenues for Google’s platforms
While the TAC remained stable in the first six months of 2020, compared to 2019. Other cost of revenues increased substantially (over $4 billion). Some key aspects determined TAC to remain stable:
TAC rate on Google properties increased due to the ongoing shift to mobile, which carries higher TAC because more mobile searches are channeled through paid access points.
This increase was partially offset by the favorable revenue mix shift from Google Network Members’ properties to Google properties.
Cost of revenues increased by over $4 billion for the six months ended June 30, 2020, compared to 2019 was due to an increase in data center and other operations costs and an increase in content acquisition costs primarily for YouTube consistent with the growth in YouTube revenues. This increase was partially offset by a decline in hardware costs.
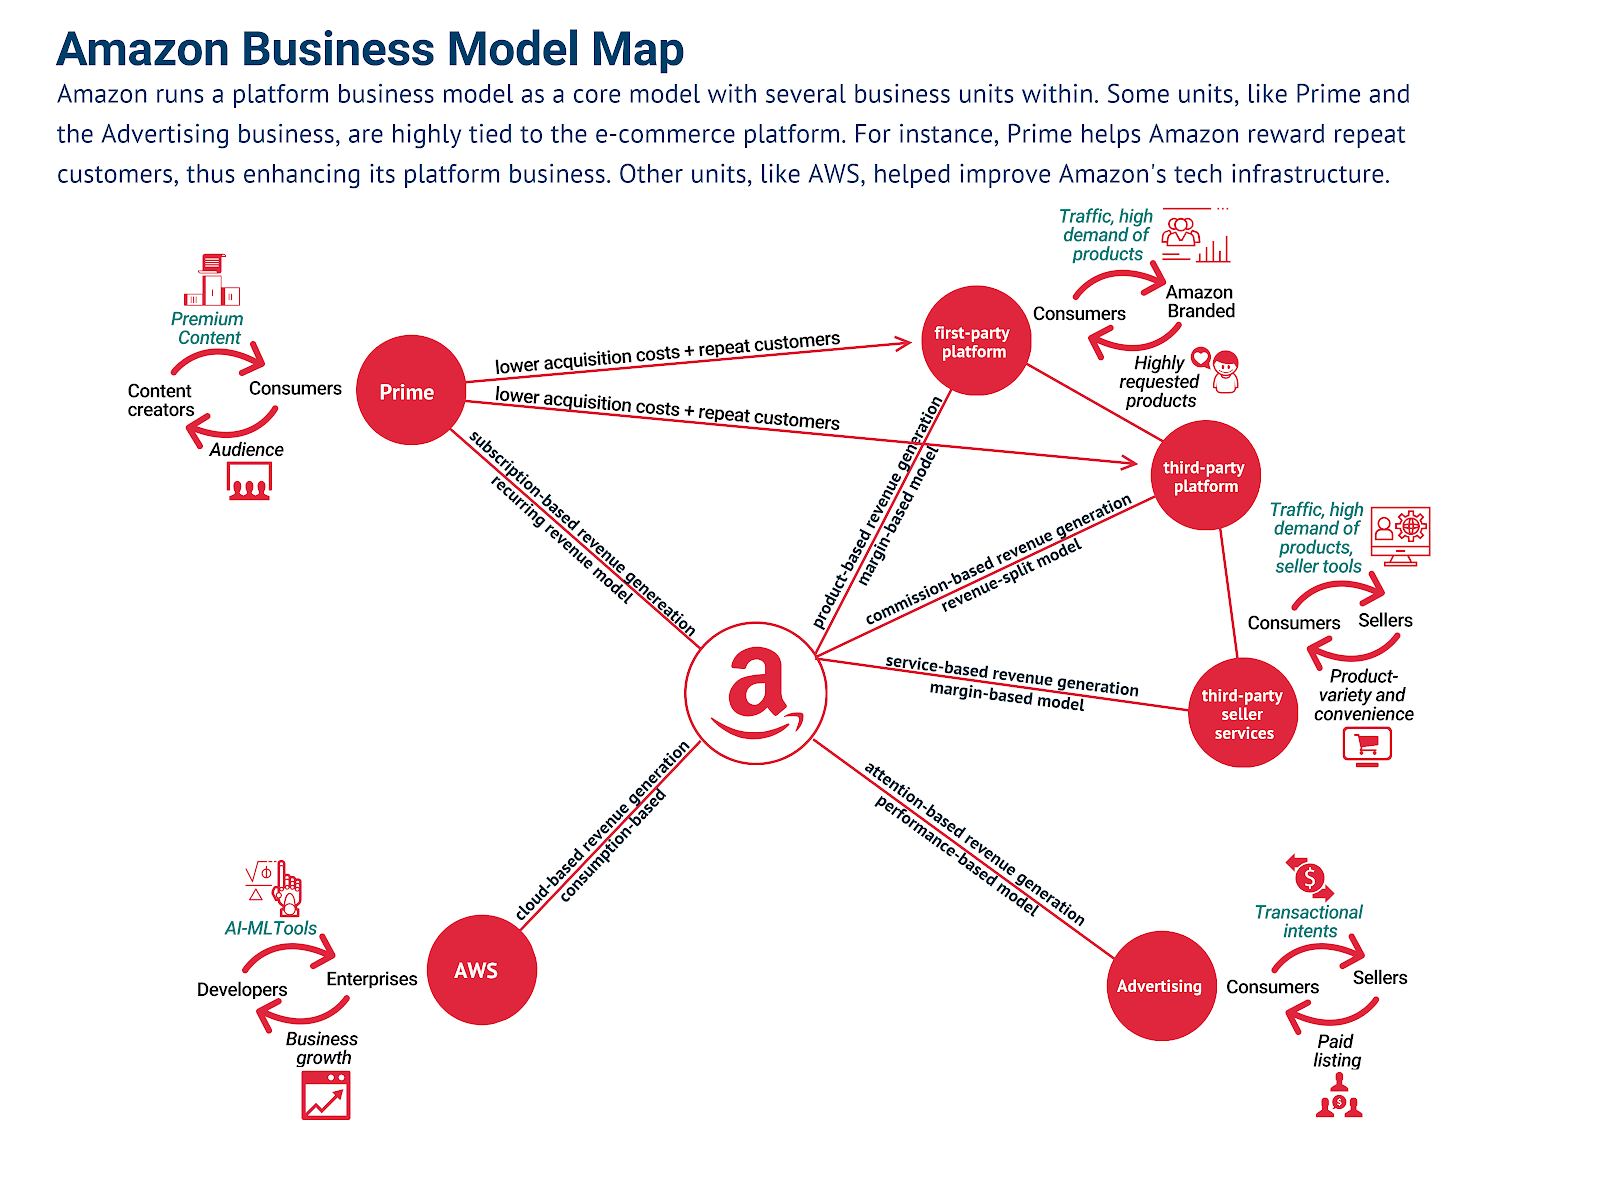
While Amazon is primarily a consumer e-commerce platform, its tentacles move in many directions:
The starting point of Amazon success is its e-commerce consumer platform, which products are broken down into:
Amazon branded products: which are products that Amazon either acquired or developed over the years.
Amazon third-partiesproducts: which are products that Amazon hosted on its own e-commerce platform. Those products benefit from Amazon e-commerce visibility and sustained traffic.
On top of the core consumer e-commerce platform the whole Amazon business model has been developed over the years. In fact, for Amazon third-parties sellers that host their products on Amazon, they can further benefit from:
Amazon third-party seller services: Amazon built over the years services like fulfilled by Amazon, which enable sellers to host their inventories, and delivery with Amazon, thus collecting a royalty as a result of the sales made on the platform.
As a natural line of business for Amazon, advertising enabled those third-party sellers to gain more visibility on the platform. Therefore the other revenue stream is:
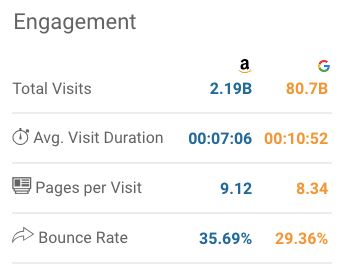
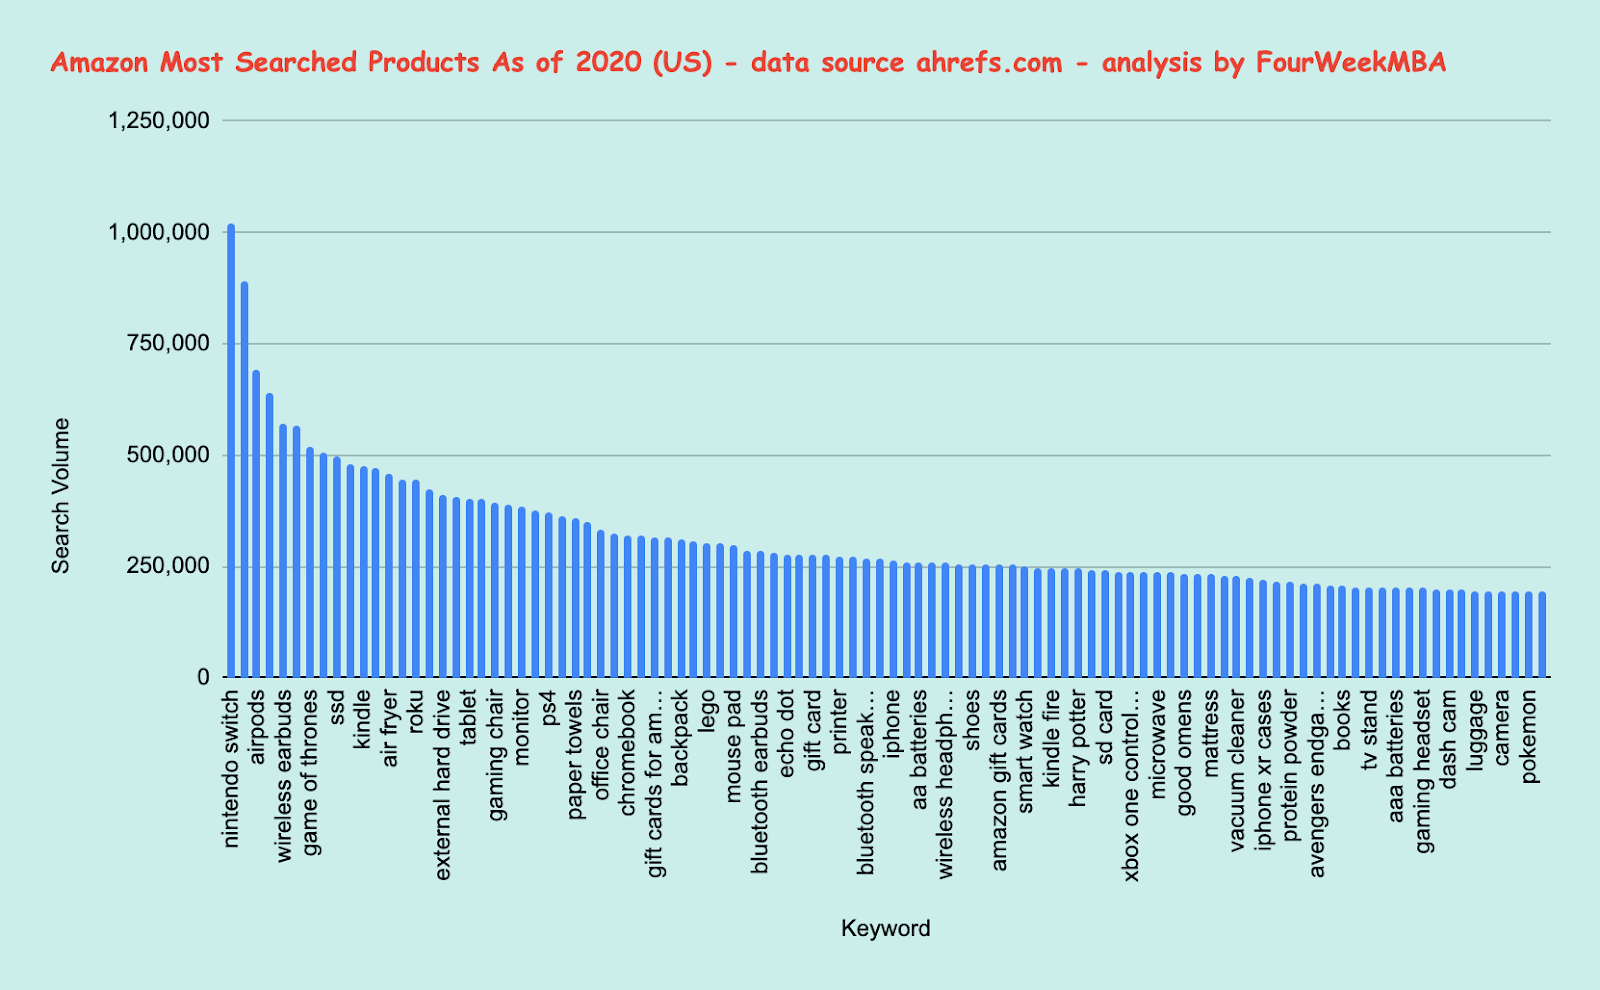
Product advertising: Amazon is the most popular product search engine. While the platform is much smaller than Google in terms of absolute search volume. In reality, Amazon has what Google had tried to develop for decades: pure product search. Google born naturally as a search engine emphasized for years also on product search (what was known as Froogle). That is why Amazon has build within its product search also an advertising machine worth now billions of dollars.
Amazon vs. Google traffic comparison, by SimilarWeb – May 2020. Where Amazon is still small compared to Google in terms of total traffic. Most of the traffic on the platform has a high commercial value (meaning people look for products not information). That means Amazon still has a lot of space to grow and get more of the digital advertising cake, which is Google’s primary businessmodel.
Among the many trials and errors Amazon also developed a successful program, called Amazon Prime, which turned out to be a great wat for Amazon to increase repeat business:
Amazon Prime: born as an attempt by Amazon to increase the repeat business on the e-commerce platform, Prime turned into a real streaming entertaining business, competing with other companies, like Netflix.
In the choice of hosting third-party products on the platform, Amazon had to develop its own, strong infrastructure. Hosting third-party products was not a simple choice, as Jeff Bezos highlighted over and over again, throughout the years. However, it expanded on Amazon’s mission to offer more variety, while keeping prices low:
Amazon AWS: Amazon AWS turned into a powerhouse infrastructure, that not only enabled Amazon transition toward becoming a consumer e-commerce platform, but also an infrastructure able to support many small, medium and enterprise customers across the world.
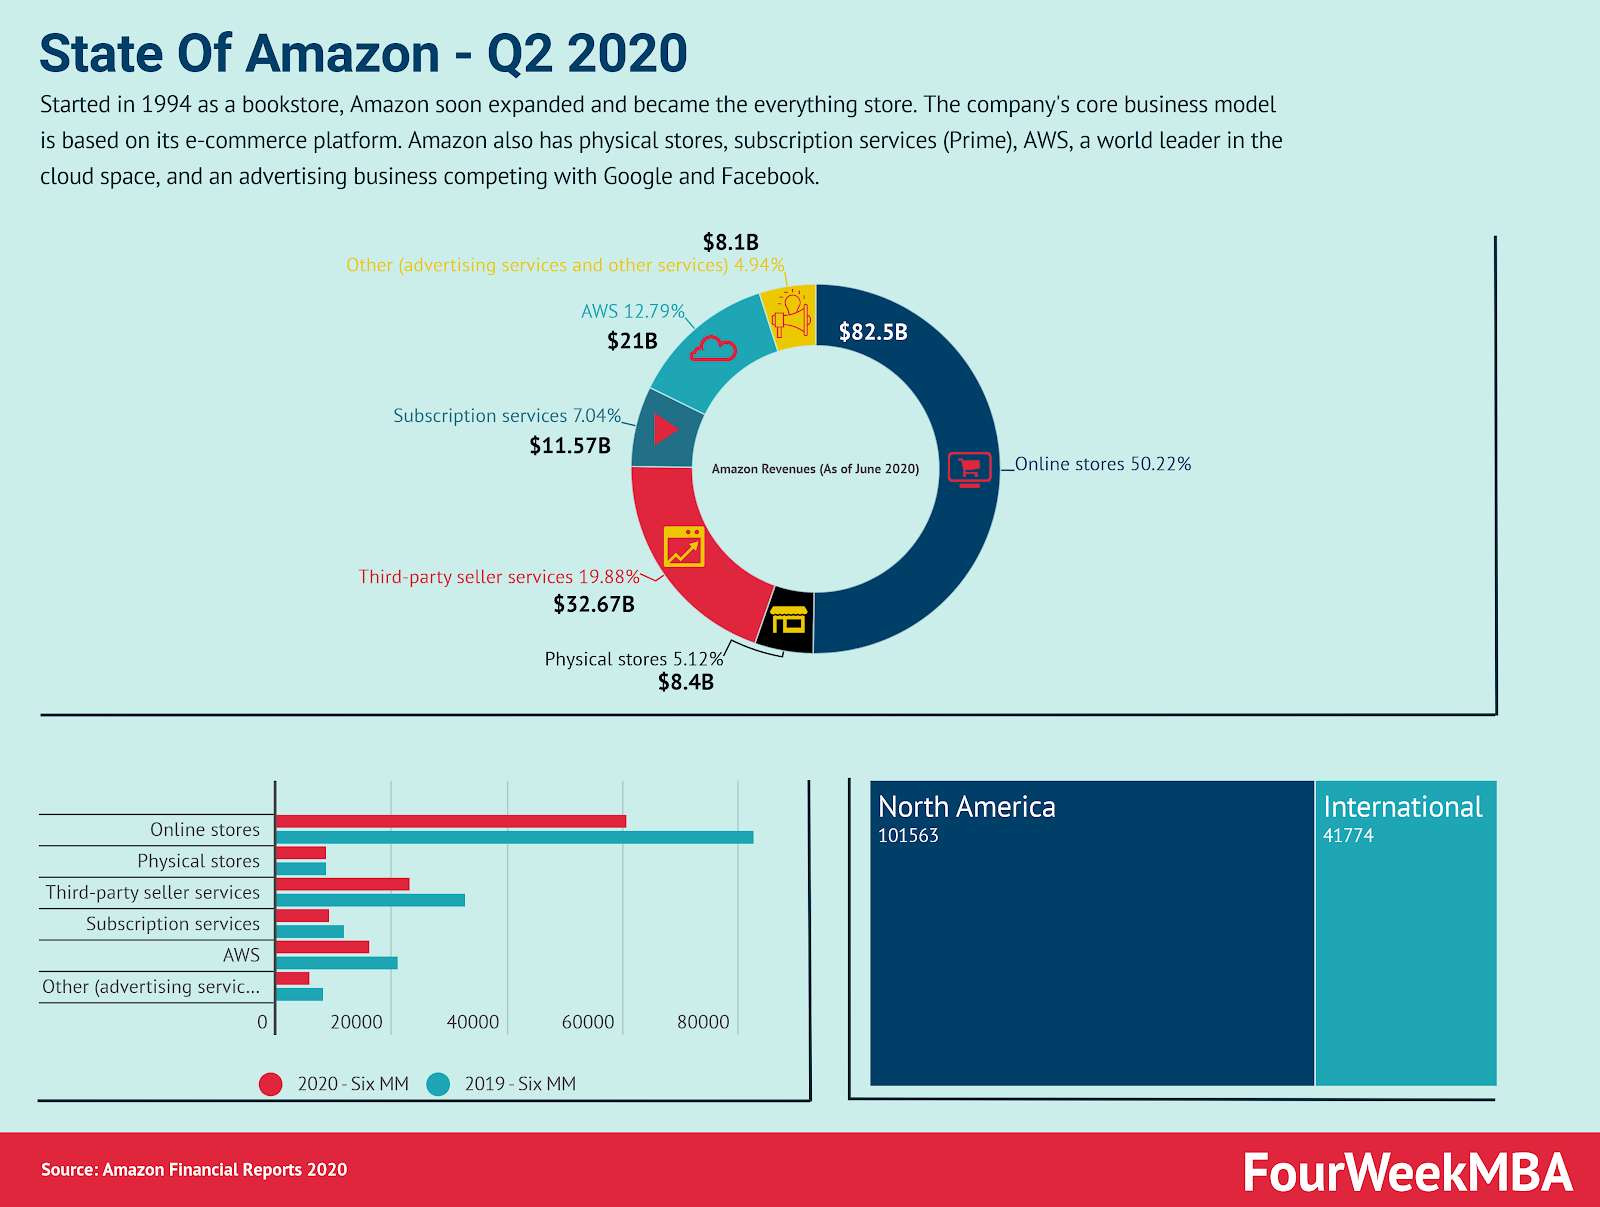
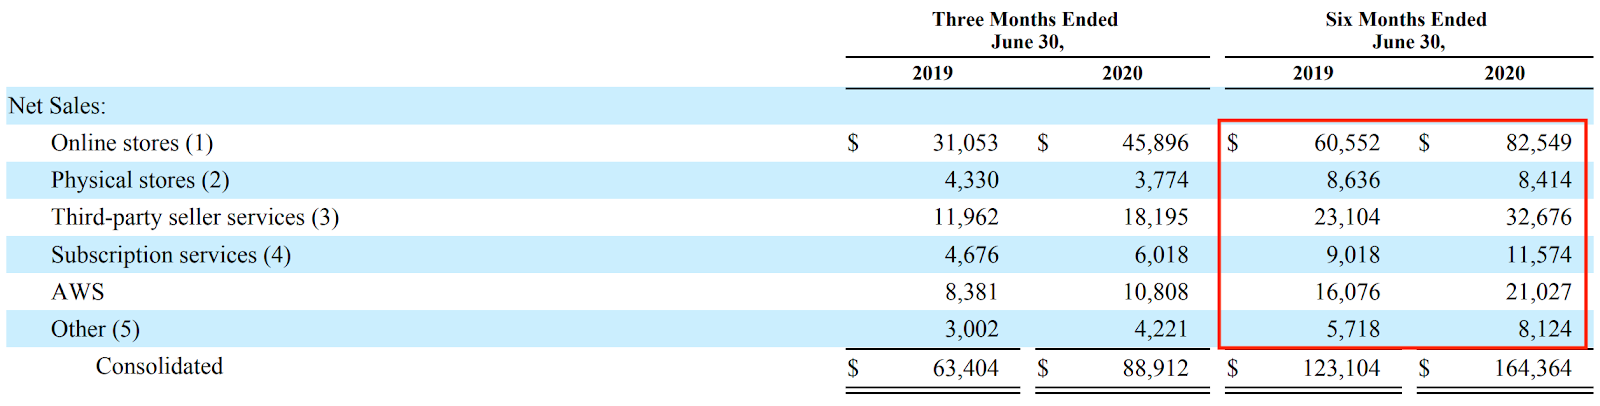
As a result of the pandemic all the segments of Amazon grew substantially (only exceptions were physical stores, which comprises Whole Foods).
Online stores growth also drove the growth of third-party seller services, subscription services and AWS. Those segments (subscriptions and AWS) also moved independently from the other segments, as Amazon has successfully developed a diversified business model.
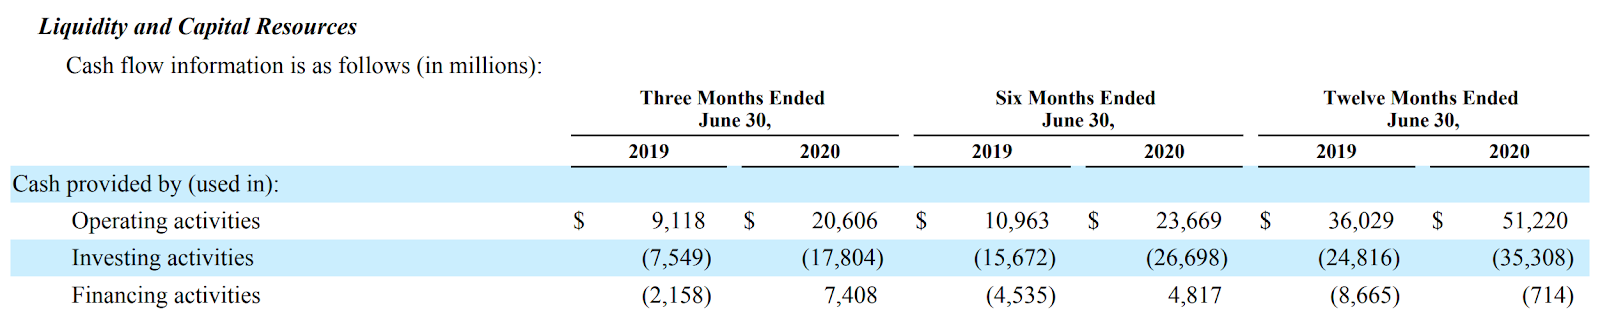
Amazon’s ability to unlock substantial cash from operations is a key characteristic from its business model.
Amazon runs at positive cash conversion cycles, which makes it possible for the company to generate massive amounts of cash, nonetheless its tighter margins, from the e-commerce platform, compared to other segments like AWS.
Perhaps, by June 2020, Amazon recorded over $23 billion in operating cash flows as of June 2020. This result was driven by cash received from consumers (credit card purchases on Amazon.com), sellers (money earned via third-party services and revenue-split), developers (for Amazon AWS), enterprises (AWS) , and content creator customers, and advertisers.
To understand how Amazon generates cash from operations quickly, that’s Because consumers primarily use credit cards to buy from Amazon, therefore receivables from consumers settle quickly.
In short, Amazon is pretty good in managing its working capital, affected by:
Inventory management.
Category expansion.
Timing of cash receipts and payments.
Vendor payment terms.
Therefore, by quickly turning its inventory into sales, by enabling third-party sellers to easily list on Amazon, thus making more products available on the platform; by collecting credit cards payments from customers; and by paying sellers on the platform at longer intervals (like 60-90 days); Amazon is able to move substantial cash flows, that it quickly invests back in expanding the business, making it more efficient, thus prompting further its flywheel.
For instance, as Amazon recorded a cash inflow for the first six months of 2020, it reinvested it (that is why you have negative investing cash flows) in additional capacity to support its fulfillment operations and in support of continued business growth in technology infrastructure (the majority of which is to support AWS).
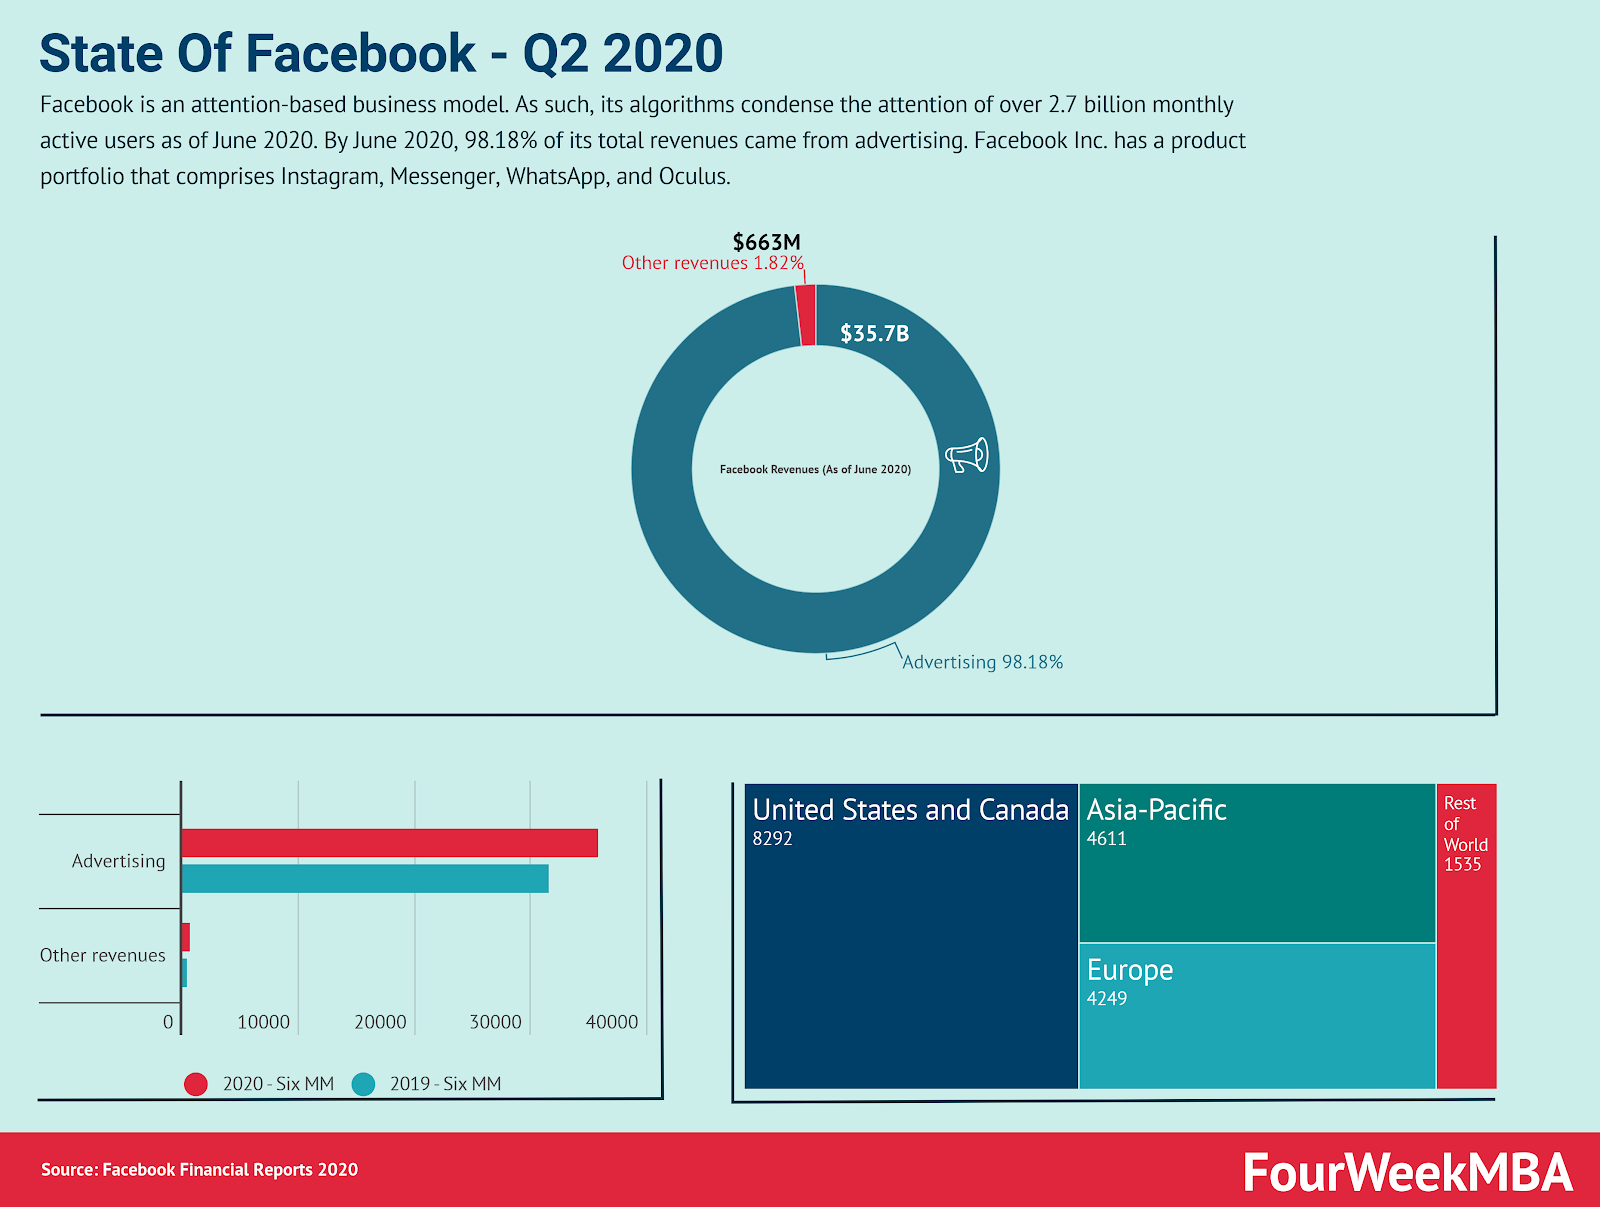
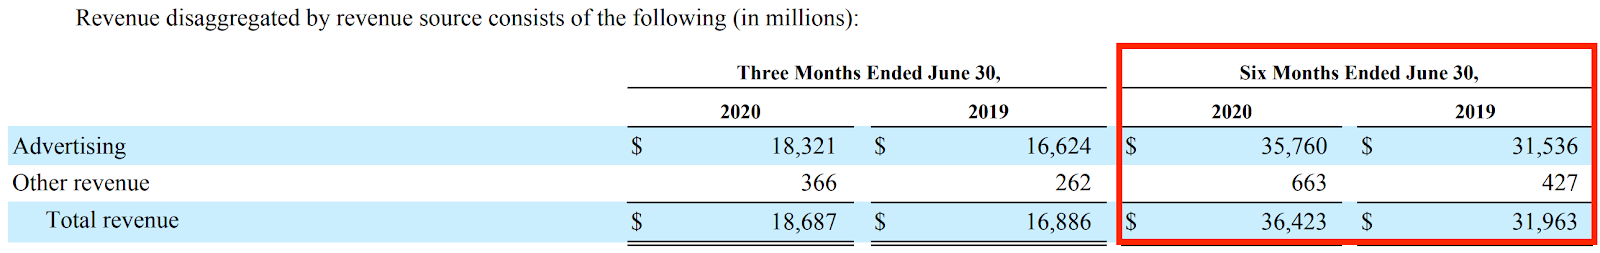
Facebook is an attention-based business model, which revenues primarily come from advertising (over 98% as of June 2020).
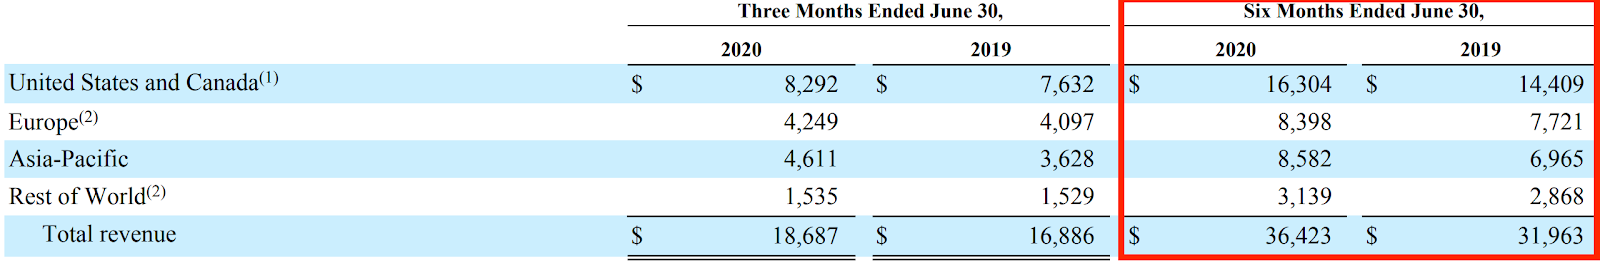
The US and Canada represent the markets with highest monetization power, together with Europe.
Other markets, like Asia-Pacific are important in the coming years, yet they have a lower monetization bandwidth as of June 2020.
Mobile is the highest growing advertising segment in terms of revenues.
Instagram is the strongest product in terms of users and revenues.
The overall stability of Facebook business model in the coming years will highly depend on its ability to retain users engagement on the platform, and better monetize other markets, beyond US and Canada.
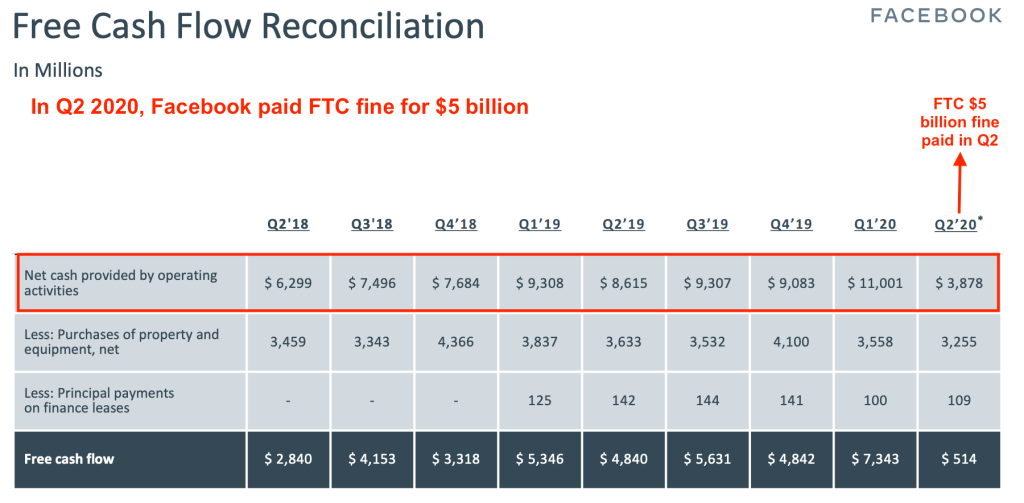
Facebook income was reduced in Q2 2020, by the payment of the FTC fine for $5 billion.
Facebook is expanding in India, with an investment of $5.7 billion in Reliance Jio Platforms, the largest media group on India.
A visual glance at the Facebook business model key metrics
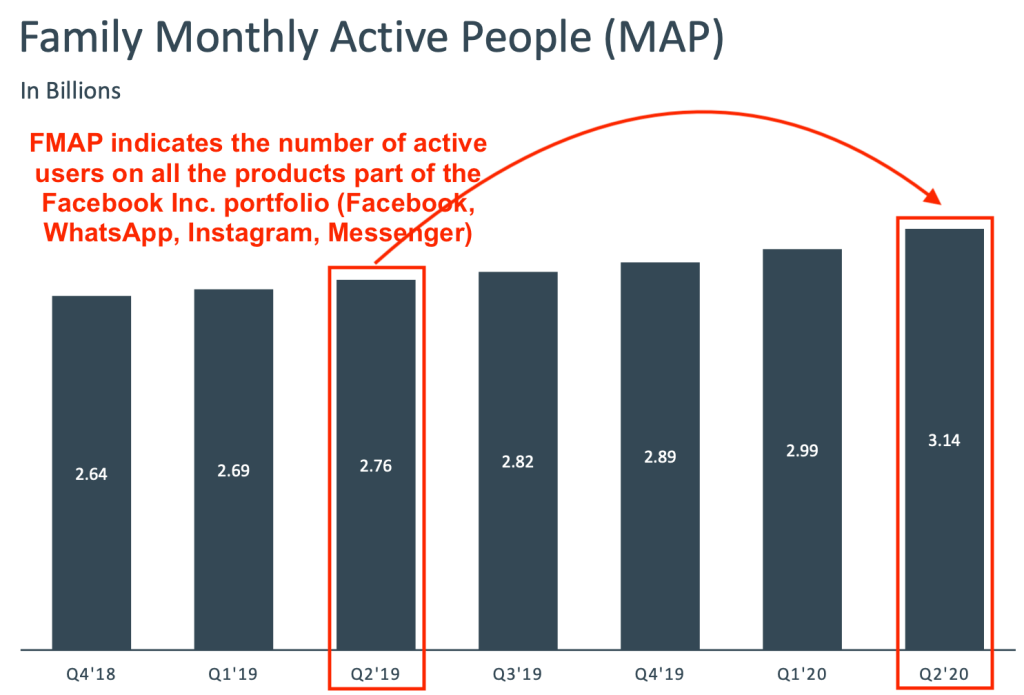
FMAP indicates the number of active users on all the products part of the Facebook Inc. portfolio (Facebook, WhatsApp, Instagram, Messenger):
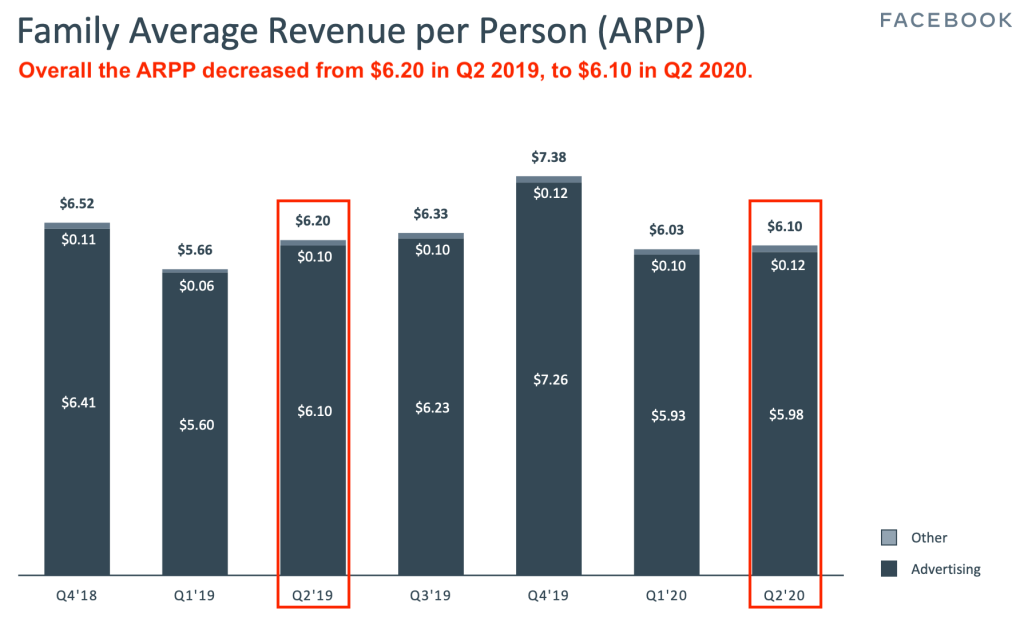
The average revenue per person decreased from $6.20 in Q2 2019, to $6.10 in Q2 2020. Overall the Facebook Inc. revenues increased, thanks to the offset of Q1, where the company recorded an higher ARPP ($6.03) vs. 2019 ($6.2).
Let’s give a look at the breakdown of the average revenue per person in each geographic region.
The ARPU increased only in the US&Canada and Europe, while it decreased in Asia-Pacific and Rest of World.
Overall the company recorded an increase in monthly active users, for the portfolio of products. It went from 2.76 billion to 3.14 billions by Q2, 2020.
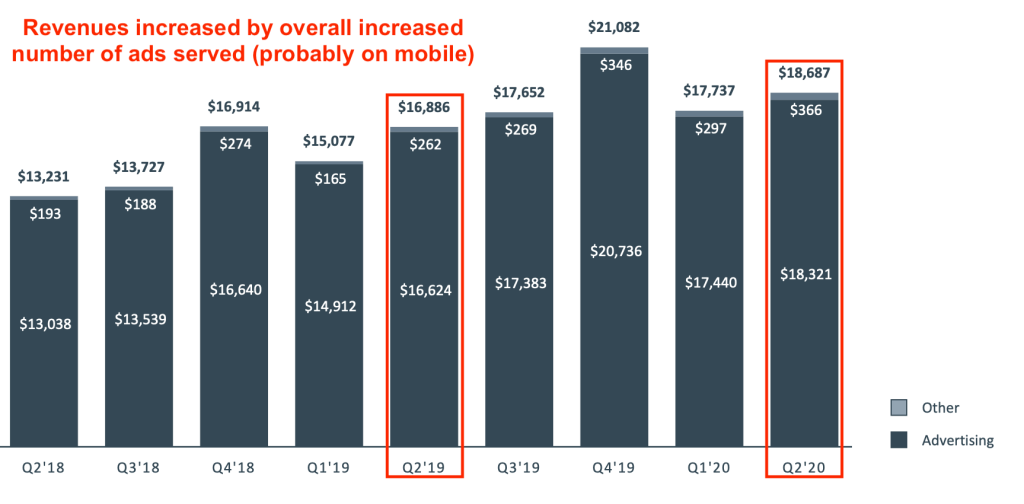
Overall revenues increased thanks to the number of ads served.
A more indepth look at Facebook advertising machine
Revenue in the six months ended June 30, 2020, compared to the same period in 2019, increased by $4.46 billion, or 14%.
What caused the multi-billion dollar increase of Facebook advertising machine? Mobile news feed…
Increases in revenues were mostly due to an increase in the number of ads delivered, partially offset by a decrease in the average price per ad. In short, the substantial increase in advertising served on the platform, offset the reduced advertising costs for businesses on the platform.
In fact, the number of ads delivered increased by 40%, faster than the increase of 33% in the same periods in 2019. This shows the continued growth of the Facebook advertising machine, even during the pandemic.
The increase in the ads delivered was driven by:
An increase in the number and frequency of ads displayed across Facebook products.
And an increase in users and their engagement, particularly with Facebook mobile News Feed.
As of the six months ended June 30, 2020, the average price per ad decreased by 19%, compared with a decrease of approximately 4% in both of the same periods in 2019. The decrease in average price per ad was primarily driven by a decrease in advertising demand globally due to the COVID-19 pandemic beginning in the first quarter of 2020.
The decrease in average price per ad was also caused by an increasing proportion of the number of ads delivered as Stories ads and in geographies that monetize at lower rates.
Continued growth in the United States, Canada and Europe (for the factors shown above) was the primary driver for Facebook growth. However, to notice that also the sustained growth in new markets, like Asia-Pacific and Rest of World contributed to Facebook revenues growth.
In the second quarter of 2020, Facebook continued to focus on its main revenue growth priorities:
Helping marketers use products to connect with consumers.
Making ads more relevant and effective (more targeted).
Moving faster on the development of AR/VR consumer hardware
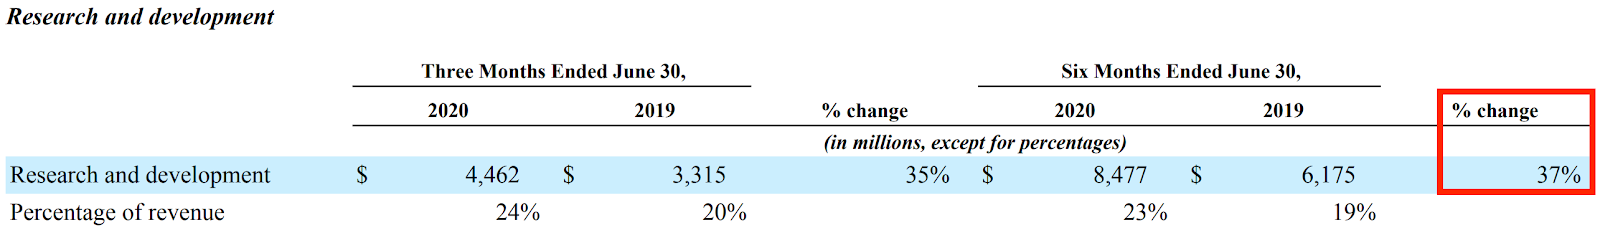
Research and development expenses in the six months ended June 30, 2020 increased by $2.30 billion, or 37%, compared to the same periods in 2019. The increase was primarily due to increases in payroll and benefits expenses as a result of a 41% growth in employee headcount in Facebook engineering team and other technical functions. Part of the headcount increase might have been due to the expansion of the engineering team able to help the platform’s compliance with new privacy regulations.
On the other hand, the headcount increase was also due to functions supporting consumer hardware product development. In short, It seems that Facebook is pushing much more on the development side of AR/VR sets.
Some key highlights:
Facebook daily active users (DAUs) were 1.79 billion on average for June 2020 (an increase of 12% year-over-year).
Facebook monthly active users (MAUs) were 2.70 billion as of June 30, 2020 (an increase of 12% year-over-year).
Family daily active people (DAP) was 2.47 billion on average for June 2020 (an increase of 15% year-over-year).
Family monthly active people (MAP) was 3.14 billion as of June 30, 2020 (an increase of 14% year-over-year).
Revenue was $36.4 billion by June 2020, compared to the same period of 2019, (an increase of about 14% year-over-year).
Total costs and expenses were $24.56 billion.
Income from operations was $11.85 billion, with a 32.5% operating margin.
Headcount was 52,534 as of June 30, 2020 (an increase of 32% year-over-year).
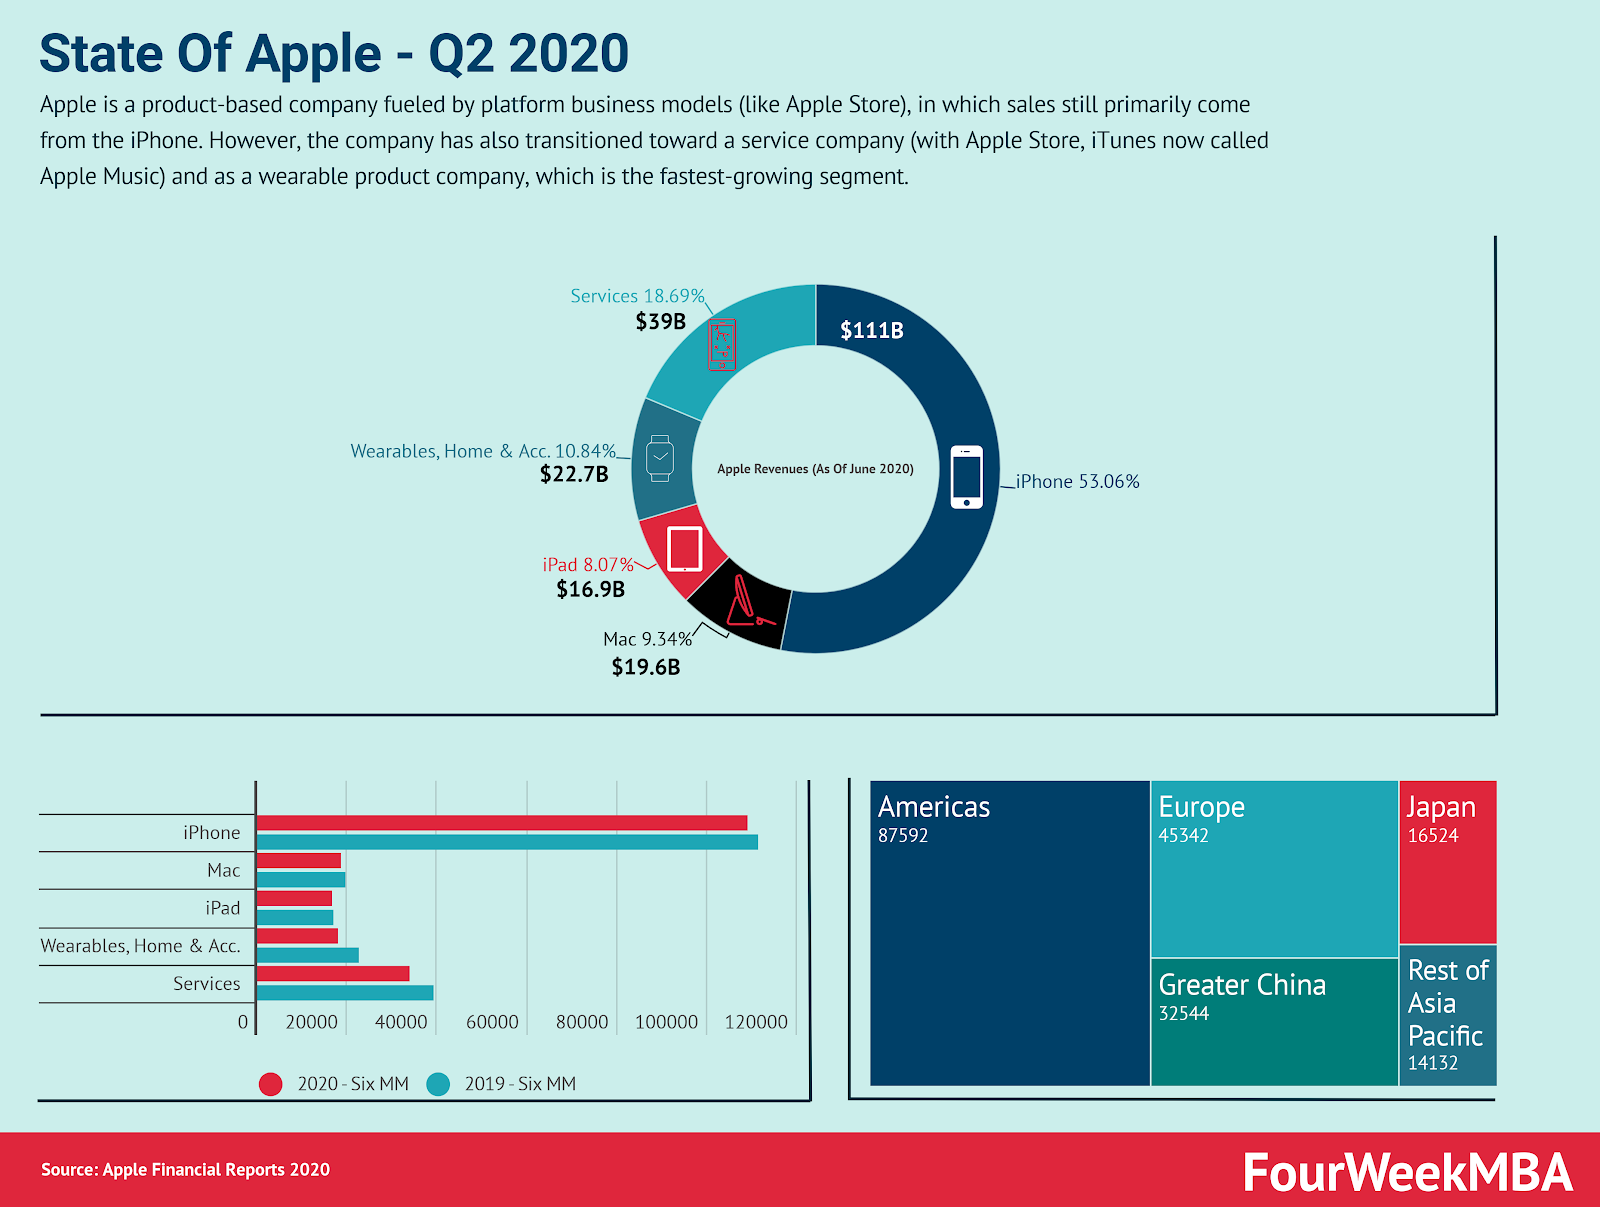
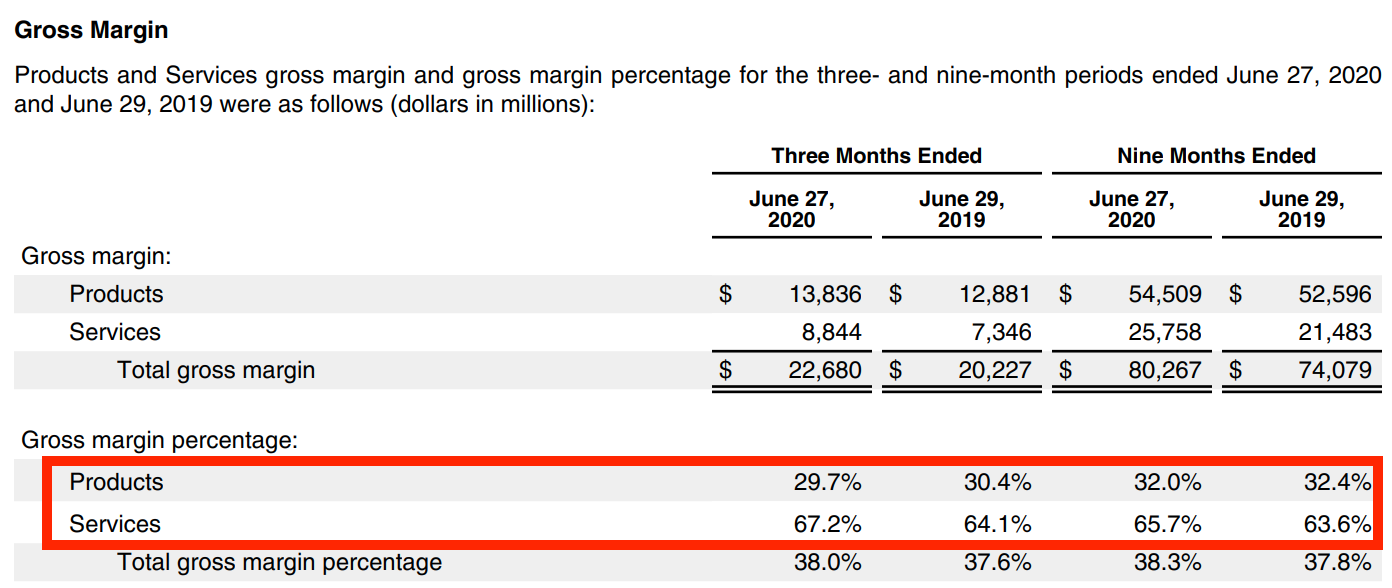
Apple used to be solely a product company. Yet its strong products also brought it to develop into a service company. It’s important to highlight that those two segments walk hand in hand. There would be no Apple’s services, if there were no Apple products.
Therefore, forgetting this simple premise, might make analysis or business people in genera, be fooled by looking at numbers in a sterile way. No doubt that the service side is interesting because it has much higher margins than the product side. But once again, without great products there wouldn’t be any service company.
Therefore, Apple business model can be broken down into two main broad categories:
Products.
And services.
The service side of the business has been developed over the years on top of the product-side. The product side of the business comprises three core products, and a set of new products:
Core products: iPhone, Mac, iPad.
Other products: Wearables, Home and Accessories.
Within the core products:
iPhone: which is the core company’s products that by June 2020, made up 53% of its revenues.
Mac: the core Mac products, and the most sold are the MacBook Air and the MacBook Pro.
iPad: with the new generations of iPads Apple managed to maintain momentum. It’s interesting to notice that the tablet segment is almost as big as the computer segment.
The other products comprise Wearables, Home and Accessories, such as: AirPods, Apple TV, Apple Watch, Beats products, HomePod, iPod touch and Apple-branded and third-party accessories.
Some key highlights of the Apple business model, as of June 2020.
iPhone SE sustained Apple’s phone sales
iPhone net sales increased as of June 2020 compared to the same period, in 2019. primarily to net sales of the new iPhone SE released in 2020. Year-over-year iPhone net sales also increased primarily to higher net sales of iPhone 11, 11 Pro and 11 Pro Max.
MacBook Pro and MacBook Air sustained computer’s sales
Mac net sales increased during 2020 compared to 2019 due to higher net sales of MacBook Pro and MacBook Air. Year-over-year Mac net sales increased especially thanks to higher net sales of MacBook Pro.
With new iPad models, tablet segment is becoming as big as the computer’s segment
iPad net sales increased in 2020 compared to the same period in 2019 due primarily to higher net sales of iPad Pro. Year-over-year though net sales increased especially thanks to the sales of iPad Air.
It seems that after years of development of this new market, this is finally surpassing the computer’s segment.
Accessories as fastest growing product segment
Wearables, Home and Accessories net sales increased in 2020, compared to the same period in 2019, due primarily to higher net sales of AirPods. AirPods sales became the most profitable within the new product line.
Product-based company, building a solid service and advertising business
Services net sales increased in 2020 compared to the same period of 2019 due primarily to higher net sales from the App Store, Video and Cloud Services. Year-over-year net sales from services gained momentum thanks to the App Store, Advertising and AppleCare.
Advertising net sales includes net sales from licensing arrangements and the Company’s advertising platforms.
Gennaro is the creator of FourWeekMBA, which reached about four million business people, comprising C-level executives, investors, analysts, product managers, and aspiring digital entrepreneurs in 2022 alone | He is also Director of Sales for a high-tech scaleup in the AI Industry | In 2012, Gennaro earned an International MBA with emphasis on Corporate Finance and Business Strategy.
Discover more from FourWeekMBA
Subscribe now to keep reading and get access to the full archive.


? The Big Hairy Audacious Goal In A Nutshell")


